Mapped: The 10 U.S. States With the Lowest Real GDP Growth
Ranked: The World’s 50 Largest Private Equity Firms
Top 10 Countries Most in Debt to the IMF
Ranked: The Top 6 Economies by Share of Global GDP (1980-2024)
Mapped: Europe’s GDP Per Capita, by Country
Countries With the Highest Rates of Crypto Ownership
Mapped: The Number of AI Startups By Country
All of the Grants Given by the U.S. CHIPS Act
Visualizing AI Patents by Country
How Tech Logos Have Evolved Over Time
Visualizing America’s Average Retirement Savings, by Age
Visualizing the Tax Burden of Every U.S. State
Charted: What Frustrates Americans About the Tax System
Ranked: The Top 20 Countries in Debt to China
Mapped: Countries Where Recreational Cannabis is Legal
Which Countries Have the Highest Infant Mortality Rates?
Life Expectancy by Region (1950-2050F)
What Causes Preventable Child Deaths?
The Cost of an EpiPen in Major Markets
Who’s Building the Most Solar Energy?
Mapped: The Age of Energy Projects in Interconnection Queues, by State
Ranked: The Top 10 EV Battery Manufacturers in 2023
The World’s Biggest Nuclear Energy Producers
The World’s Biggest Oil Producers in 2023
Mapped: The Top Exports in Asian Countries
Mapped: U.S. States By Number of Cities Over 250,000 Residents
Mapped: U.S. Immigrants by Region
The Biggest Salt Producing Countries in 2023
Visualizing Copper Production by Country in 2023
Where the World’s Aluminum is Smelted, by Country
Visualizing Global Gold Production in 2023
How People Get Around in America, Europe, and Asia
The Carbon Footprint of Major Travel Methods
Ranking the Top 15 Countries by Carbon Tax Revenue
Ranked: The Countries With the Most Air Pollution in 2023
Top Countries By Forest Growth Since 2001
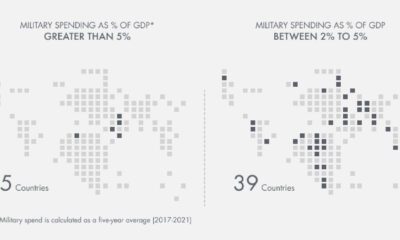
Which countries have the highest military spend relative to their economy? This visual breaks down the amount spent in each country by GDP.
Global wealth stands at over $454 trillion. This graphic shows how it's distributed, by various levels of net worth.
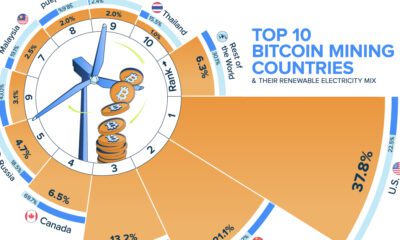
Bitcoin miners worldwide use about 348 TWh of electricity per year, as much as some countries, but just where does all that power come from?
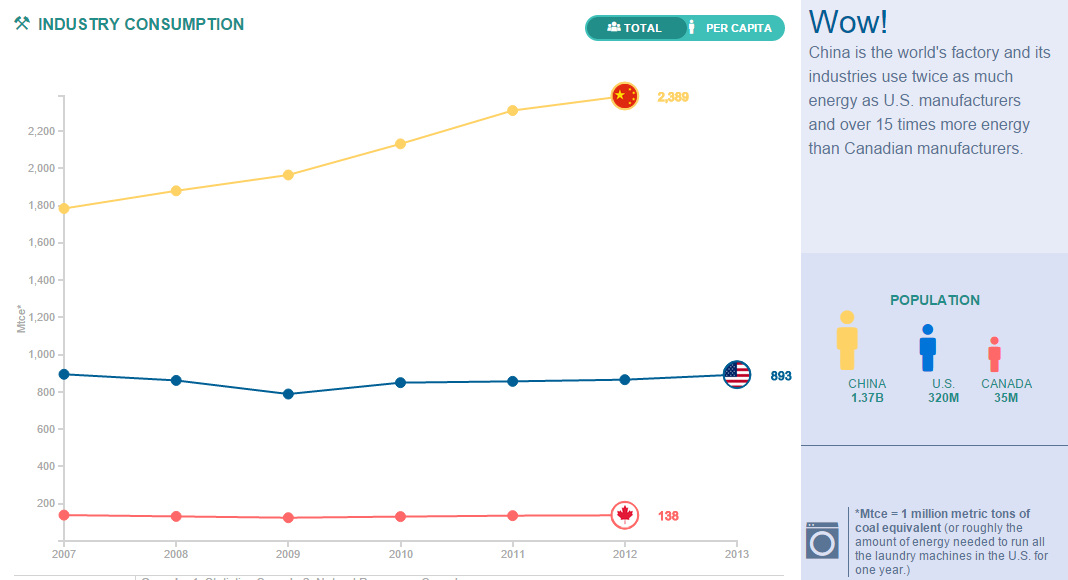
Compare the United States, China, and Canada side-by-side to see the differences in how these energy titans consume, produce, and import/export energy.
OpenAI is now one of the world's top websites, rapidly approaching the level of traffic received by TikTok and Amazon.
As millions of people continue to show up for work during the COVID-19 pandemic, many face a higher risk of potential exposure to the virus.
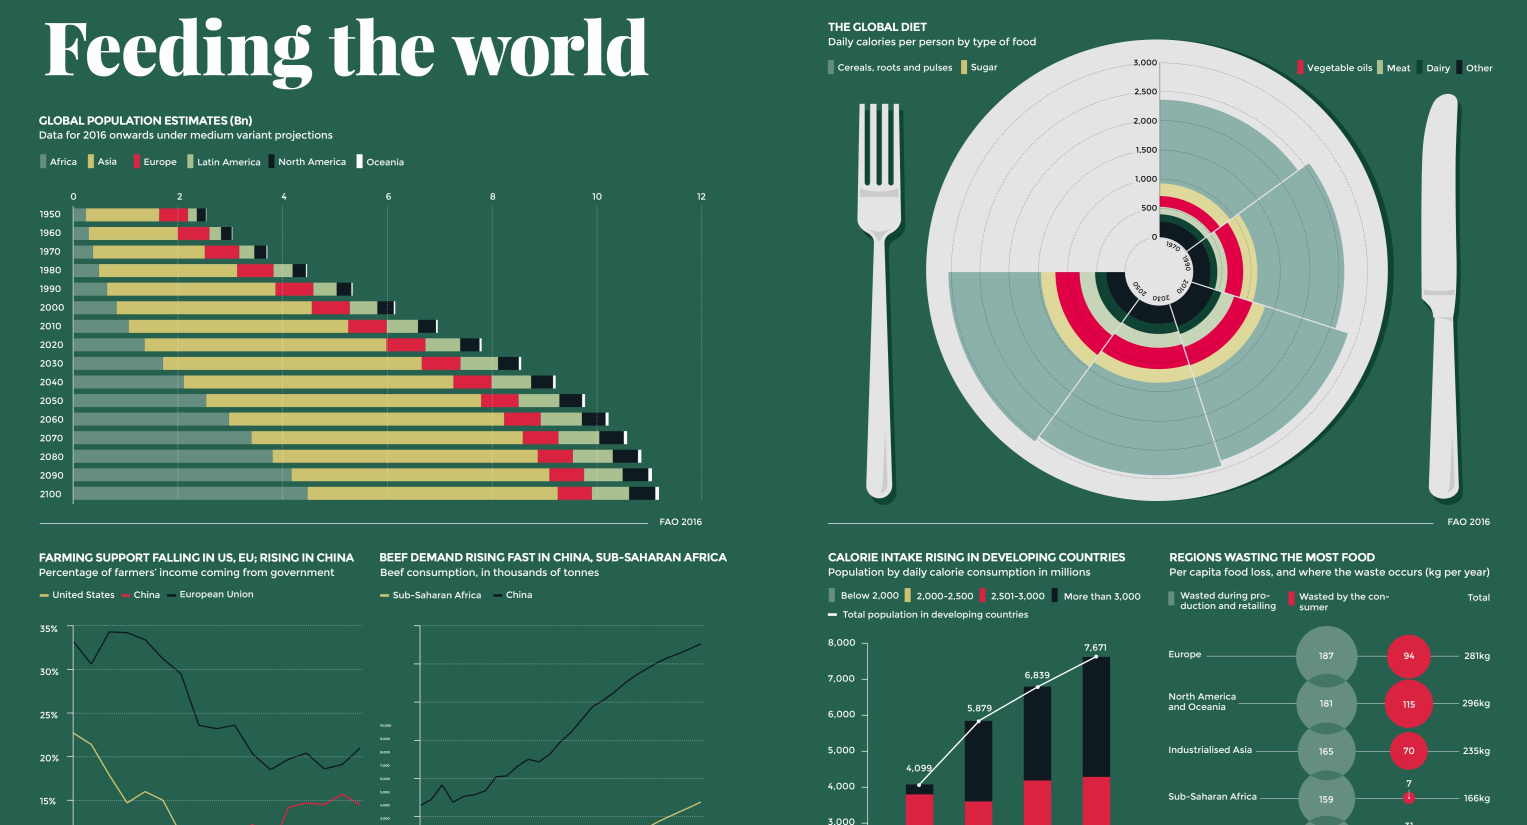
The global population will grow by billions in the coming years - but more importantly, the global diet is changing rapidly, as well.
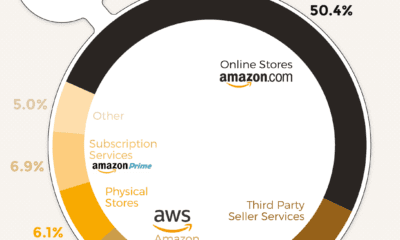
In 2019, Amazon generated $281 billion in total revenue—but where does all this revenue come from? Here’s a breakdown of how Amazon makes its money.
Upcoming features on VC+ in the next month include the Best of Trendline, as well as a crystal ball into future trends.
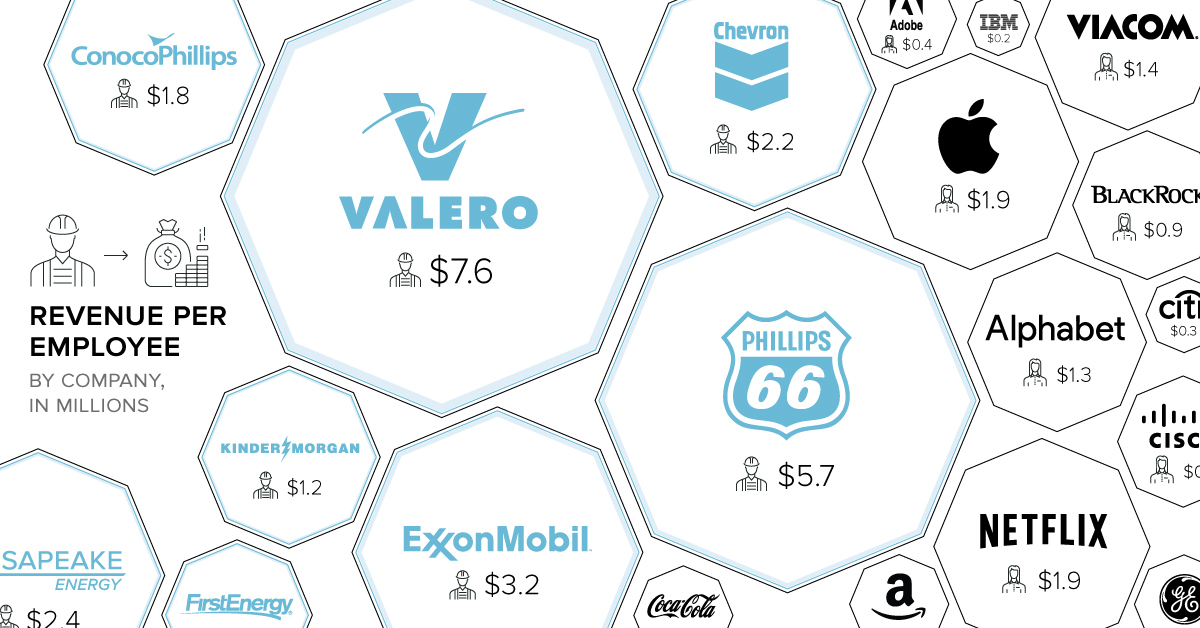
When it comes to revenue per employee, energy companies dominate. On average, oil companies bring in 2x more per employee than companies in other sectors.


 Creator Program