Mapped: The 10 U.S. States With the Lowest Real GDP Growth
Ranked: The World’s 50 Largest Private Equity Firms
Top 10 Countries Most in Debt to the IMF
Ranked: The Top 6 Economies by Share of Global GDP (1980-2024)
Mapped: Europe’s GDP Per Capita, by Country
Countries With the Highest Rates of Crypto Ownership
Mapped: The Number of AI Startups By Country
All of the Grants Given by the U.S. CHIPS Act
Visualizing AI Patents by Country
How Tech Logos Have Evolved Over Time
Visualizing America’s Average Retirement Savings, by Age
Visualizing the Tax Burden of Every U.S. State
Charted: What Frustrates Americans About the Tax System
Ranked: The Top 20 Countries in Debt to China
Mapped: Countries Where Recreational Cannabis is Legal
Which Countries Have the Highest Infant Mortality Rates?
Life Expectancy by Region (1950-2050F)
What Causes Preventable Child Deaths?
The Cost of an EpiPen in Major Markets
Who’s Building the Most Solar Energy?
Mapped: The Age of Energy Projects in Interconnection Queues, by State
Ranked: The Top 10 EV Battery Manufacturers in 2023
The World’s Biggest Nuclear Energy Producers
The World’s Biggest Oil Producers in 2023
Mapped: The Top Exports in Asian Countries
Mapped: U.S. States By Number of Cities Over 250,000 Residents
Mapped: U.S. Immigrants by Region
The Biggest Salt Producing Countries in 2023
Visualizing Copper Production by Country in 2023
Where the World’s Aluminum is Smelted, by Country
Visualizing Global Gold Production in 2023
How People Get Around in America, Europe, and Asia
The Carbon Footprint of Major Travel Methods
Ranking the Top 15 Countries by Carbon Tax Revenue
Ranked: The Countries With the Most Air Pollution in 2023
Top Countries By Forest Growth Since 2001
Global wealth stands at over $454 trillion. This graphic shows how it's distributed, by various levels of net worth.
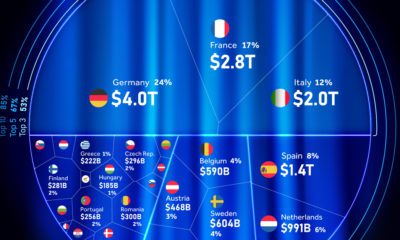
This chart shows the contributors to the EU economy through a percentage-wise distribution of country-level GDP.
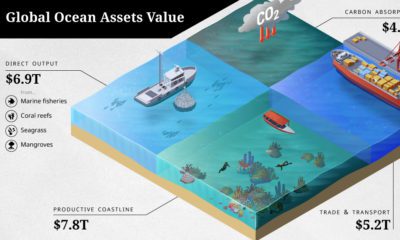
The ocean economy is under threat. How are human activities impacting the sustainable use of our ocean assets, valued at over $24 trillion?
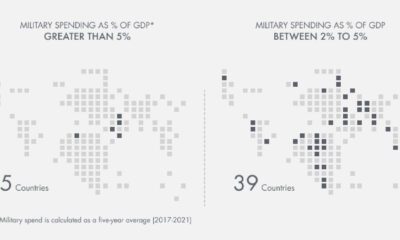
Which countries have the highest military spend relative to their economy? This visual breaks down the amount spent in each country by GDP.
New VC+ subscribers get access to a special gift: a roundup of our best ever visualizations around population.
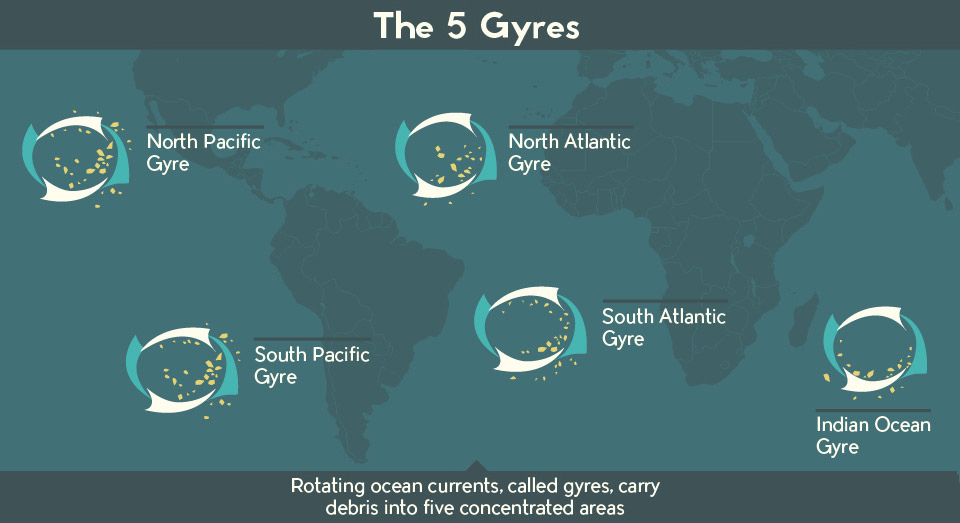
There is a staggering amount of plastic debris swirling around our oceans. This infographic and video help put this plastic problem in perspective.
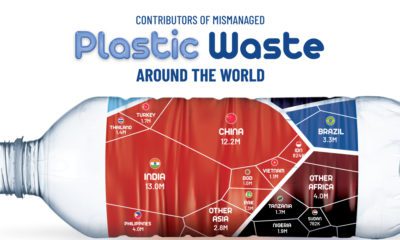
About 22% of the world's annual plastic waste generation is mismanaged. Here's a break down of mismanaged plastic waste by country.
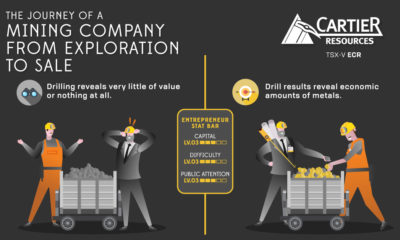
Visualizing the Journey of a Mining Entrepreneur Mining may be an industry nearly as old as humankind itself, but the process of how a patch of...
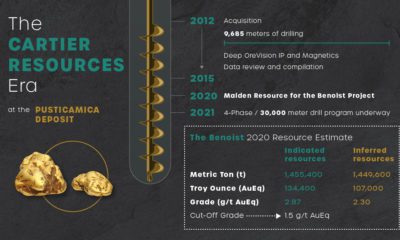
Gold exploration in Québec has a rich history. This infographic explores the work of Cartier Resources' Benoist Project in the Abitibi.
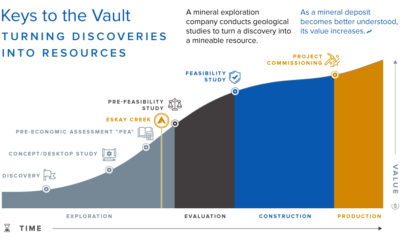
There are untold treasures in the Earth’s surface waiting for discovery. Skeena Resources is opening the vault in the Golden Triangle at Eskay Creek.


 Creator Program