Mapped: The 10 U.S. States With the Lowest Real GDP Growth
Ranked: The World’s 50 Largest Private Equity Firms
Top 10 Countries Most in Debt to the IMF
Ranked: The Top 6 Economies by Share of Global GDP (1980-2024)
Mapped: Europe’s GDP Per Capita, by Country
Countries With the Highest Rates of Crypto Ownership
Mapped: The Number of AI Startups By Country
All of the Grants Given by the U.S. CHIPS Act
Visualizing AI Patents by Country
How Tech Logos Have Evolved Over Time
Visualizing America’s Average Retirement Savings, by Age
Visualizing the Tax Burden of Every U.S. State
Charted: What Frustrates Americans About the Tax System
Ranked: The Top 20 Countries in Debt to China
Mapped: Countries Where Recreational Cannabis is Legal
Which Countries Have the Highest Infant Mortality Rates?
Life Expectancy by Region (1950-2050F)
What Causes Preventable Child Deaths?
The Cost of an EpiPen in Major Markets
Who’s Building the Most Solar Energy?
Mapped: The Age of Energy Projects in Interconnection Queues, by State
Ranked: The Top 10 EV Battery Manufacturers in 2023
The World’s Biggest Nuclear Energy Producers
The World’s Biggest Oil Producers in 2023
Mapped: The Top Exports in Asian Countries
Mapped: U.S. States By Number of Cities Over 250,000 Residents
Mapped: U.S. Immigrants by Region
The Biggest Salt Producing Countries in 2023
Visualizing Copper Production by Country in 2023
Where the World’s Aluminum is Smelted, by Country
Visualizing Global Gold Production in 2023
How People Get Around in America, Europe, and Asia
The Carbon Footprint of Major Travel Methods
Ranking the Top 15 Countries by Carbon Tax Revenue
Ranked: The Countries With the Most Air Pollution in 2023
Top Countries By Forest Growth Since 2001
This graphic compares the cost of living and purchasing power of 578 cities worldwide, using New York City as a benchmark for comparison.
As millions of people continue to show up for work during the COVID-19 pandemic, many face a higher risk of potential exposure to the virus.
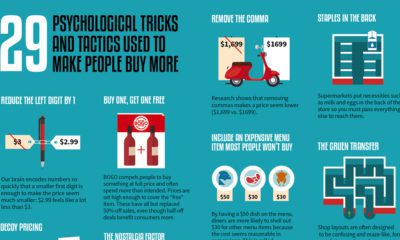
This graphic looks at 29 different psychological tricks that marketers use to try and influence consumer behavior.
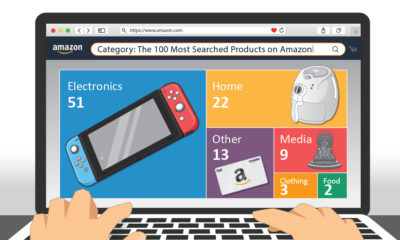
This graphic highlights the top product searches on Amazon in the U.S., providing a glimpse of what items American consumers are after.
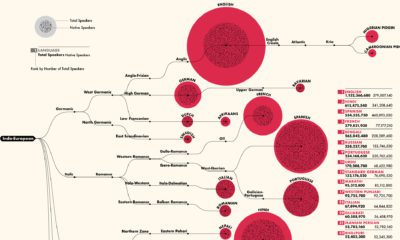
This detailed visualization breaks down the 100 most spoken languages around the world, by total and native speakers. Can you find yours on the list?
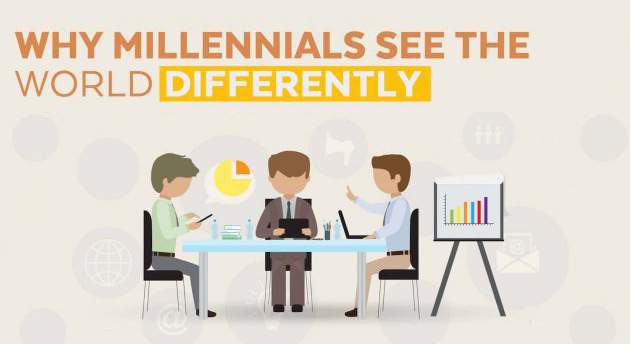
Millennials continue to puzzle the general population, but this infographic has 29 facts that may help you see millennials differently.
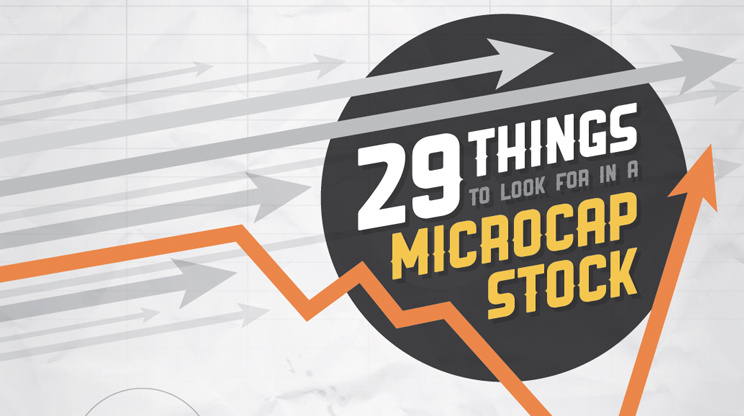
Proper due diligence is essential when investing in microcap companies. Here we provide a checklist of 29 tips to ensure smarter investing.
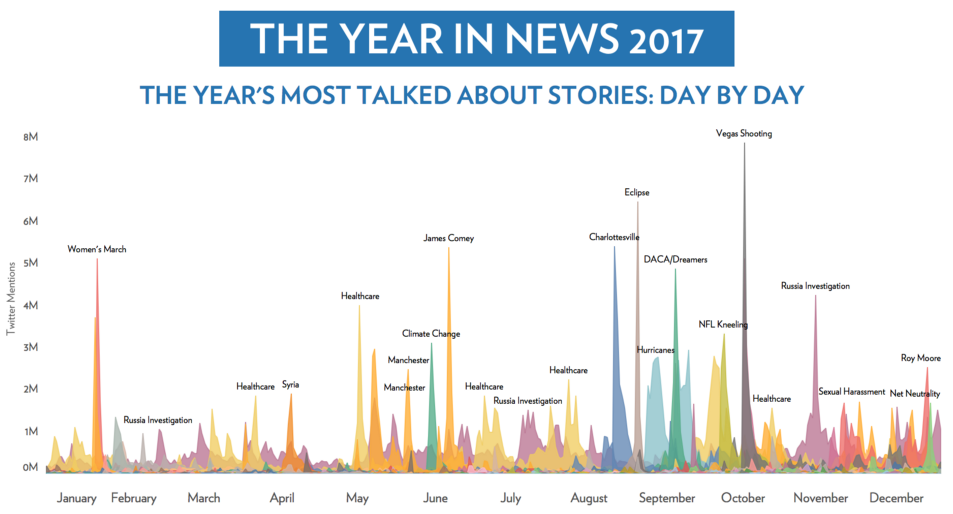
What were the most talked about news stories of 2017? This infographic crunches the data on 2.8 billion tweets to find out.
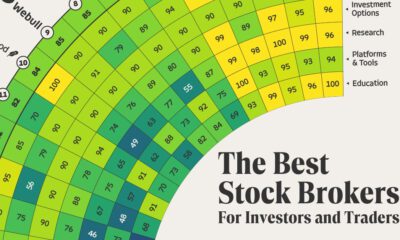
Whether you’re searching for low fees or an easy-to-use trading platform, this clear breakdown can help you find the best stock brokers.
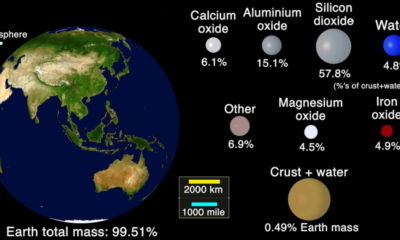
This animation shows the handful of minerals and elements that constitute the Earth's crust.


 Creator Program