Mapped: The 10 U.S. States With the Lowest Real GDP Growth
Ranked: The World’s 50 Largest Private Equity Firms
Top 10 Countries Most in Debt to the IMF
Ranked: The Top 6 Economies by Share of Global GDP (1980-2024)
Mapped: Europe’s GDP Per Capita, by Country
Countries With the Highest Rates of Crypto Ownership
Mapped: The Number of AI Startups By Country
All of the Grants Given by the U.S. CHIPS Act
Visualizing AI Patents by Country
How Tech Logos Have Evolved Over Time
Visualizing America’s Average Retirement Savings, by Age
Visualizing the Tax Burden of Every U.S. State
Charted: What Frustrates Americans About the Tax System
Ranked: The Top 20 Countries in Debt to China
Mapped: Countries Where Recreational Cannabis is Legal
Which Countries Have the Highest Infant Mortality Rates?
Life Expectancy by Region (1950-2050F)
What Causes Preventable Child Deaths?
The Cost of an EpiPen in Major Markets
Who’s Building the Most Solar Energy?
Mapped: The Age of Energy Projects in Interconnection Queues, by State
Ranked: The Top 10 EV Battery Manufacturers in 2023
The World’s Biggest Nuclear Energy Producers
The World’s Biggest Oil Producers in 2023
Mapped: The Top Exports in Asian Countries
Mapped: U.S. States By Number of Cities Over 250,000 Residents
Mapped: U.S. Immigrants by Region
The Biggest Salt Producing Countries in 2023
Visualizing Copper Production by Country in 2023
Where the World’s Aluminum is Smelted, by Country
Visualizing Global Gold Production in 2023
How People Get Around in America, Europe, and Asia
The Carbon Footprint of Major Travel Methods
Ranking the Top 15 Countries by Carbon Tax Revenue
Ranked: The Countries With the Most Air Pollution in 2023
Top Countries By Forest Growth Since 2001
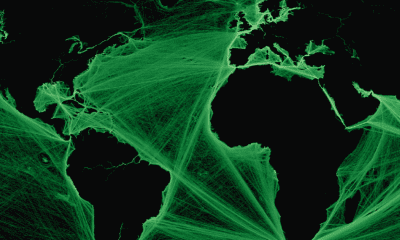
Where are the world’s major shipping lanes? These maps show global maritime traffic density, highlighting some of the busiest areas across the globe.
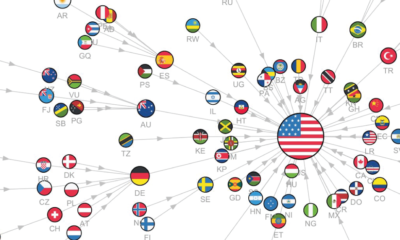
This series of visualizations uses Google trends search data to show the most googled countries around the world, from 2004 to 2022.
Here's a sneak preview of features that VC+ members will have delivered straight to their inbox in April 2022.
Here's a sneak preview of features that VC+ members will have delivered straight to their inbox in March 2022.
Here's a sneak preview of features that VC+ members will have delivered straight to their inbox in February 2022.
COVID-19 hit the global economy hard, but some companies thrived amidst the chaos. Here are the top 100 most valuable brands of 2021.
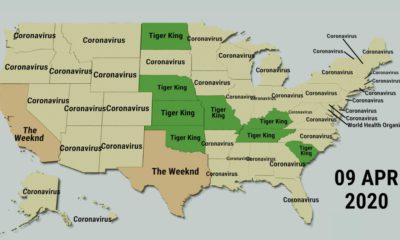
This fascinating animated map provides an overview of the top trending Google searches in every state over the last decade.
Find out how to get access to a list of our greatest visualizations of all time. Opportunity ends July 1st, 2022.
This month, we dive into bonus content from our new Generational Power Index, as well as topical visualizations in the news.
This unique map graphic uses the Great Lakes region as a point of comparison for the top 25 largest lakes in the world.


 Creator Program