Mapped: The 10 U.S. States With the Lowest Real GDP Growth
Ranked: The World’s 50 Largest Private Equity Firms
Top 10 Countries Most in Debt to the IMF
Ranked: The Top 6 Economies by Share of Global GDP (1980-2024)
Mapped: Europe’s GDP Per Capita, by Country
Countries With the Highest Rates of Crypto Ownership
Mapped: The Number of AI Startups By Country
All of the Grants Given by the U.S. CHIPS Act
Visualizing AI Patents by Country
How Tech Logos Have Evolved Over Time
Visualizing America’s Average Retirement Savings, by Age
Visualizing the Tax Burden of Every U.S. State
Charted: What Frustrates Americans About the Tax System
Ranked: The Top 20 Countries in Debt to China
Mapped: Countries Where Recreational Cannabis is Legal
Which Countries Have the Highest Infant Mortality Rates?
Life Expectancy by Region (1950-2050F)
What Causes Preventable Child Deaths?
The Cost of an EpiPen in Major Markets
Who’s Building the Most Solar Energy?
Mapped: The Age of Energy Projects in Interconnection Queues, by State
Ranked: The Top 10 EV Battery Manufacturers in 2023
The World’s Biggest Nuclear Energy Producers
The World’s Biggest Oil Producers in 2023
Mapped: The Top Exports in Asian Countries
Mapped: U.S. States By Number of Cities Over 250,000 Residents
Mapped: U.S. Immigrants by Region
The Biggest Salt Producing Countries in 2023
Visualizing Copper Production by Country in 2023
Where the World’s Aluminum is Smelted, by Country
Visualizing Global Gold Production in 2023
How People Get Around in America, Europe, and Asia
The Carbon Footprint of Major Travel Methods
Ranking the Top 15 Countries by Carbon Tax Revenue
Ranked: The Countries With the Most Air Pollution in 2023
Top Countries By Forest Growth Since 2001
Global clean energy spending is projected to reach $5.6 trillion by 2030. Which renewable sources are forecast to see the most investment?
The distribution of wealth varies dramatically around the world. This graphic shows how it breaks down by wealth level in 2023.
What were the top data visualizations on Visual Capitalist in 2023? We highlight the best charts, maps, and infographics from the year.
Join the waitlist now to be one of the first to use Voronoi.
Threads reached 100 million users in just five days. Here is a timeline of how long other popular platforms took to reach the milestone.
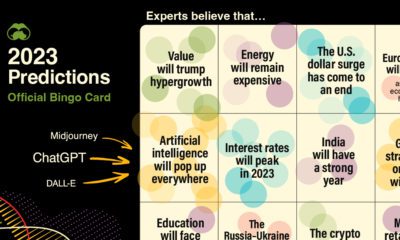
Using our database of 500+ predictions from reports, articles, interviews, and more, we highlight what experts think will happen in 2023
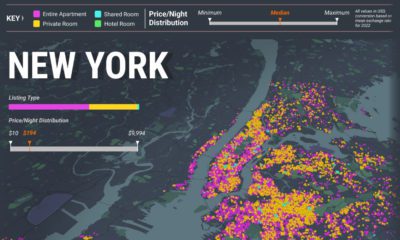
How expansive has the Airbnb landscape become? Here’s a look at every active Airbnb listing in New York, London, and Paris in Sept 2022.
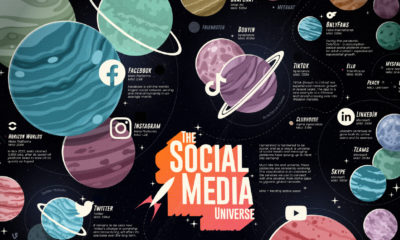
From Twitter to TikTok, this infographic compares the universe of social media and messaging platforms by number of monthly active users.
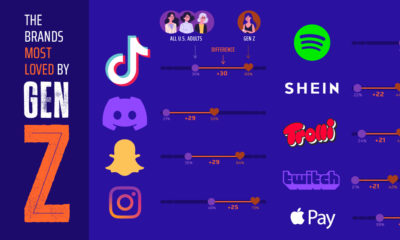
Which brands win the most with Gen Z compared to older generations? From TikTok to Capri Sun, this ranking looks at Gen Z's favorite brands.
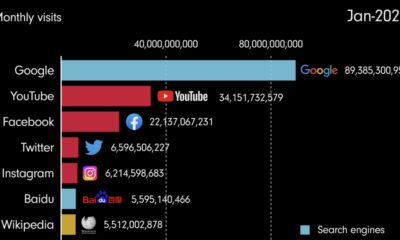
This video shows the evolution of the internet, highlighting the most popular websites from 1993 until 2022.


 Creator Program