Mapped: The 10 U.S. States With the Lowest Real GDP Growth
Ranked: The World’s 50 Largest Private Equity Firms
Top 10 Countries Most in Debt to the IMF
Ranked: The Top 6 Economies by Share of Global GDP (1980-2024)
Mapped: Europe’s GDP Per Capita, by Country
Countries With the Highest Rates of Crypto Ownership
Mapped: The Number of AI Startups By Country
All of the Grants Given by the U.S. CHIPS Act
Visualizing AI Patents by Country
How Tech Logos Have Evolved Over Time
Visualizing America’s Average Retirement Savings, by Age
Visualizing the Tax Burden of Every U.S. State
Charted: What Frustrates Americans About the Tax System
Ranked: The Top 20 Countries in Debt to China
Mapped: Countries Where Recreational Cannabis is Legal
Which Countries Have the Highest Infant Mortality Rates?
Life Expectancy by Region (1950-2050F)
What Causes Preventable Child Deaths?
The Cost of an EpiPen in Major Markets
Who’s Building the Most Solar Energy?
Mapped: The Age of Energy Projects in Interconnection Queues, by State
Ranked: The Top 10 EV Battery Manufacturers in 2023
The World’s Biggest Nuclear Energy Producers
The World’s Biggest Oil Producers in 2023
Mapped: The Top Exports in Asian Countries
Mapped: U.S. States By Number of Cities Over 250,000 Residents
Mapped: U.S. Immigrants by Region
The Biggest Salt Producing Countries in 2023
Visualizing Copper Production by Country in 2023
Where the World’s Aluminum is Smelted, by Country
Visualizing Global Gold Production in 2023
How People Get Around in America, Europe, and Asia
The Carbon Footprint of Major Travel Methods
Ranking the Top 15 Countries by Carbon Tax Revenue
Ranked: The Countries With the Most Air Pollution in 2023
Top Countries By Forest Growth Since 2001
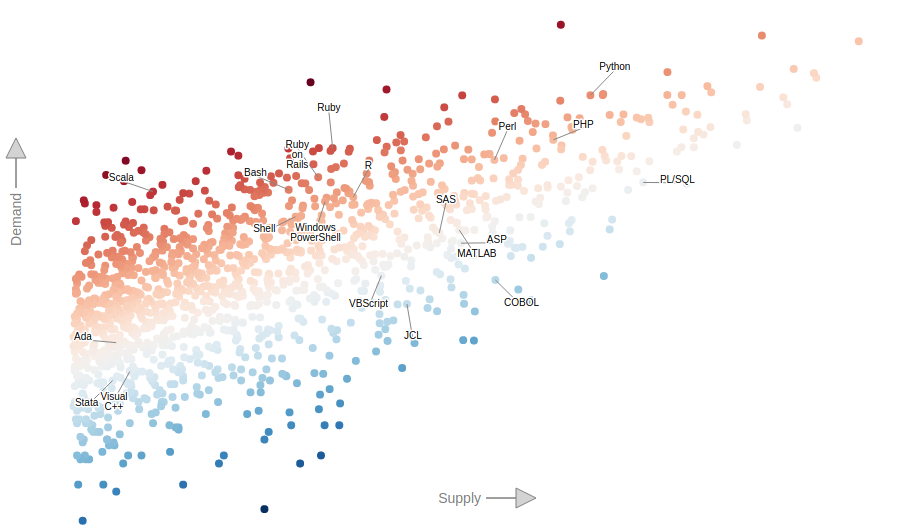
The interactive graphic helps us to visualize the relationship between the supply and demand for over 1,400 technology skills.
This month, we dive into bonus content from our new Generational Power Index, as well as topical visualizations in the news.
The continuation of our story on Germany's bout with hyperinflation in the early 1920s. We look at the effects, as well as even worse stories of...
In this visualization, we rank the top 50 websites that receive the most internet traffic, from Google to CNN.
Find out how to get access to a list of our greatest visualizations of all time. Opportunity ends July 1st, 2022.
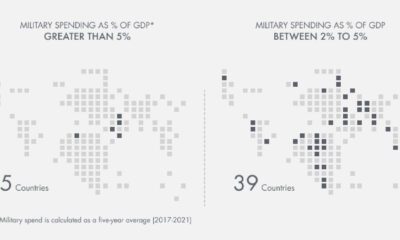
Which countries have the highest military spend relative to their economy? This visual breaks down the amount spent in each country by GDP.
This graphic compares the cost of living and purchasing power of 578 cities worldwide, using New York City as a benchmark for comparison.
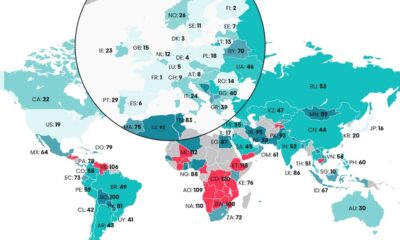
The Digital Quality of Life Index shows which countries are doing a better job than others in providing accessible and affordable internet.
This infographic details the rise and fall of Bre-X and the Busang gold discovery in Indonesia - one of the biggest scandals in capital markets history.
In a complex world, the combined forces of data and visual communication take on new importance. See our top 20 visualizations for 2020.


 Creator Program