Mapped: The 10 U.S. States With the Lowest Real GDP Growth
Ranked: The World’s 50 Largest Private Equity Firms
Top 10 Countries Most in Debt to the IMF
Ranked: The Top 6 Economies by Share of Global GDP (1980-2024)
Mapped: Europe’s GDP Per Capita, by Country
Countries With the Highest Rates of Crypto Ownership
Mapped: The Number of AI Startups By Country
All of the Grants Given by the U.S. CHIPS Act
Visualizing AI Patents by Country
How Tech Logos Have Evolved Over Time
Visualizing America’s Average Retirement Savings, by Age
Visualizing the Tax Burden of Every U.S. State
Charted: What Frustrates Americans About the Tax System
Ranked: The Top 20 Countries in Debt to China
Mapped: Countries Where Recreational Cannabis is Legal
Which Countries Have the Highest Infant Mortality Rates?
Life Expectancy by Region (1950-2050F)
What Causes Preventable Child Deaths?
The Cost of an EpiPen in Major Markets
Who’s Building the Most Solar Energy?
Mapped: The Age of Energy Projects in Interconnection Queues, by State
Ranked: The Top 10 EV Battery Manufacturers in 2023
The World’s Biggest Nuclear Energy Producers
The World’s Biggest Oil Producers in 2023
Mapped: The Top Exports in Asian Countries
Mapped: U.S. States By Number of Cities Over 250,000 Residents
Mapped: U.S. Immigrants by Region
The Biggest Salt Producing Countries in 2023
Visualizing Copper Production by Country in 2023
Where the World’s Aluminum is Smelted, by Country
Visualizing Global Gold Production in 2023
How People Get Around in America, Europe, and Asia
The Carbon Footprint of Major Travel Methods
Ranking the Top 15 Countries by Carbon Tax Revenue
Ranked: The Countries With the Most Air Pollution in 2023
Top Countries By Forest Growth Since 2001
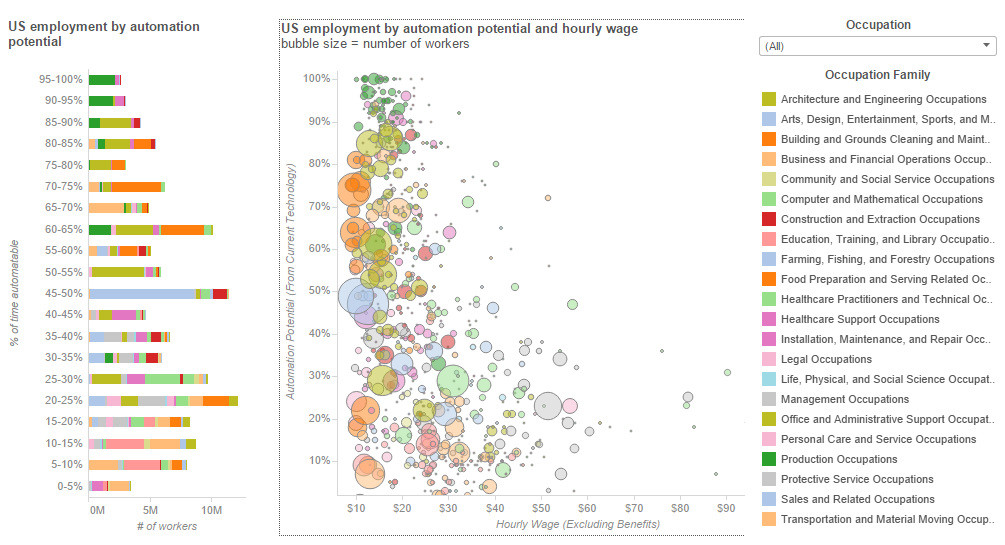
What jobs are most likely to be done by robots in the future? This interactive data visualization shows the automation potential of nearly 800 jobs.
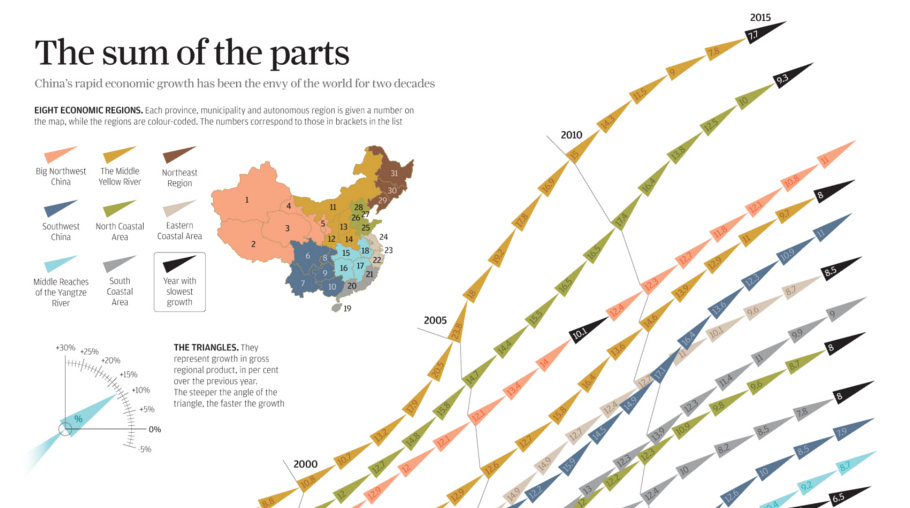
China's economic miracle over the last 20 years is the sum of its parts, with each region of the country contributing to growth in different ways.
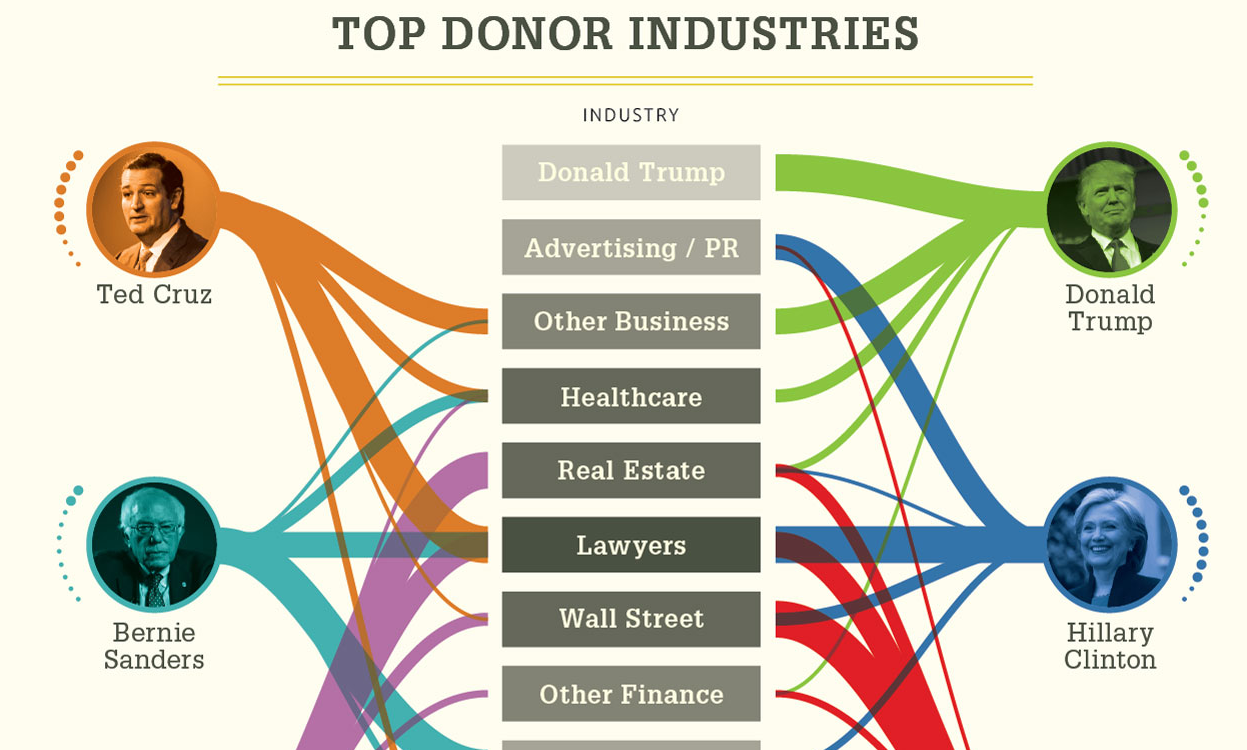
What if politicians displayed their donors on their uniforms like NASCAR drivers?
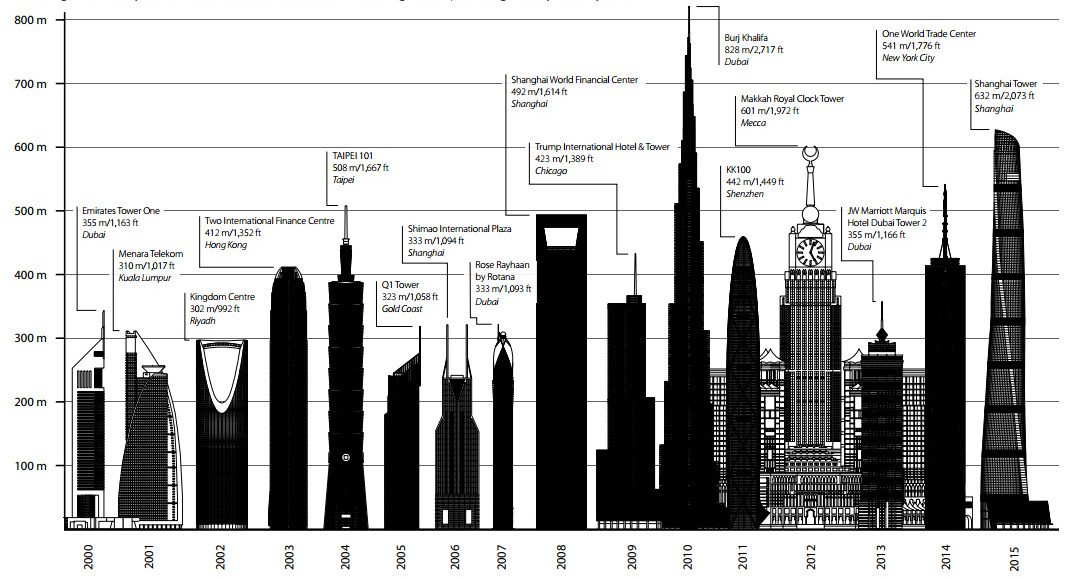
These visualizations show how the tallest skyscraper of 2015 compares to other years, as well as other buildings completed last year.
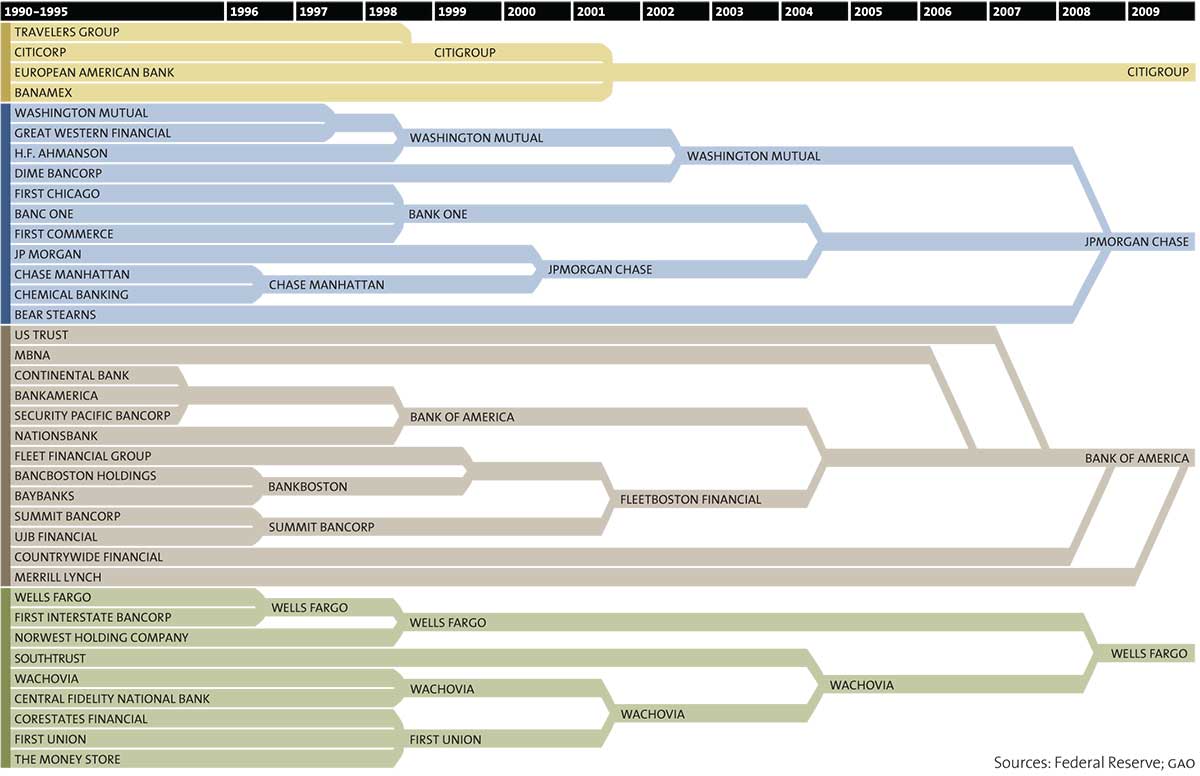
The Big Four retail banks in the United States hold 45%, or $4.6 trillion, of all customer bank deposits. This chart shows consolidation in banking.
Hyperinflation has happened hundreds of times throughout history, but today we present the origins of the world's most famous case in Germany after WW1.
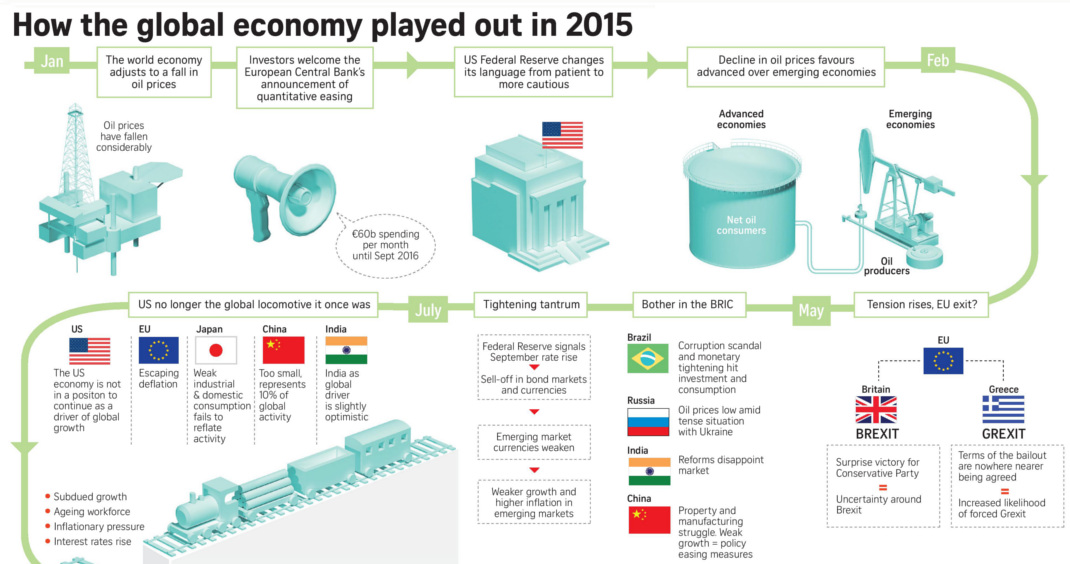
This infographic recaps economic events and sentiment in 2015. Should investors approach the new year with renewed optimism or brace for volatility?
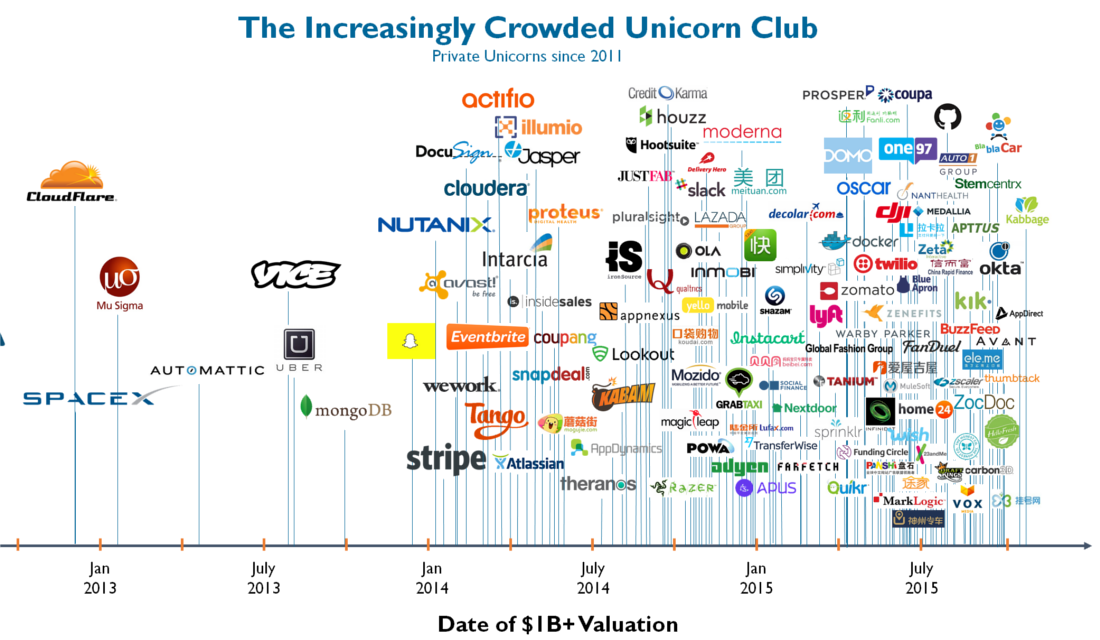
The elite group of startups worth over $1 billion - the unicorn club - is becoming increasingly crowded. Will it continue to remain frothy for investors?
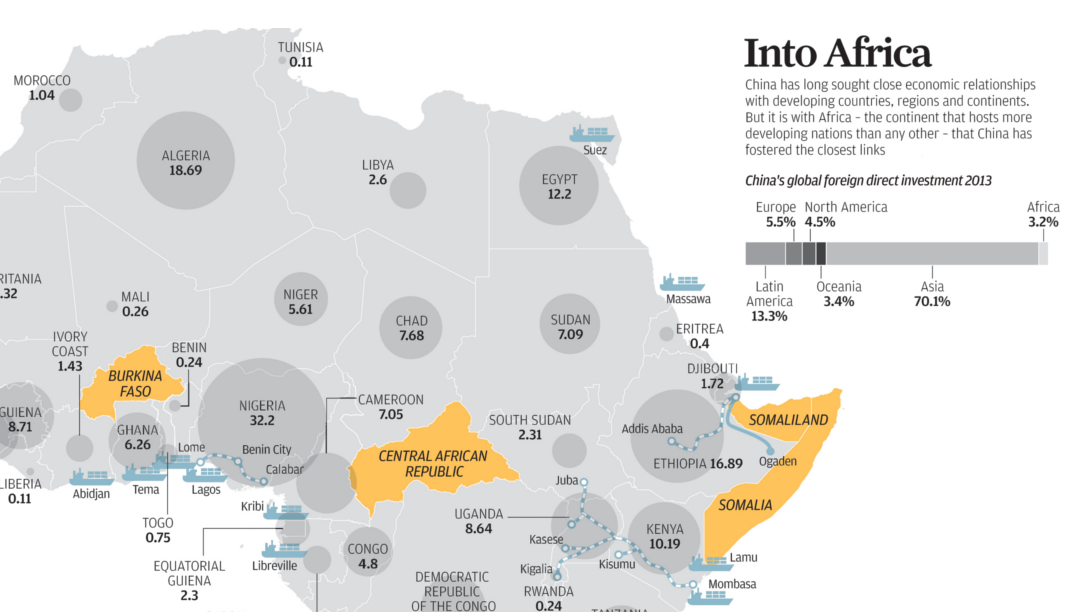
Over the last decade, China has poured billions of dollars of investment into the African continent. See this information visualized.
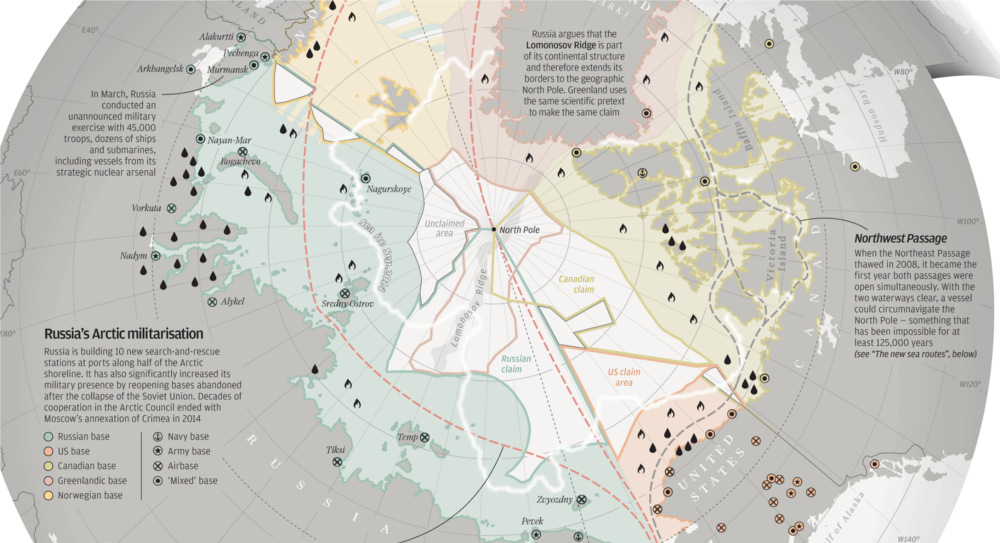
With Arctic ice thawing, the race for natural resources, shipping routes, and other territorial claims is heating up. The race for Arctic Domination is on.