Markets
All of the World’s Exports by Country, in One Chart
Article/Editing:
All of the World’s Exports by Country, in One Chart
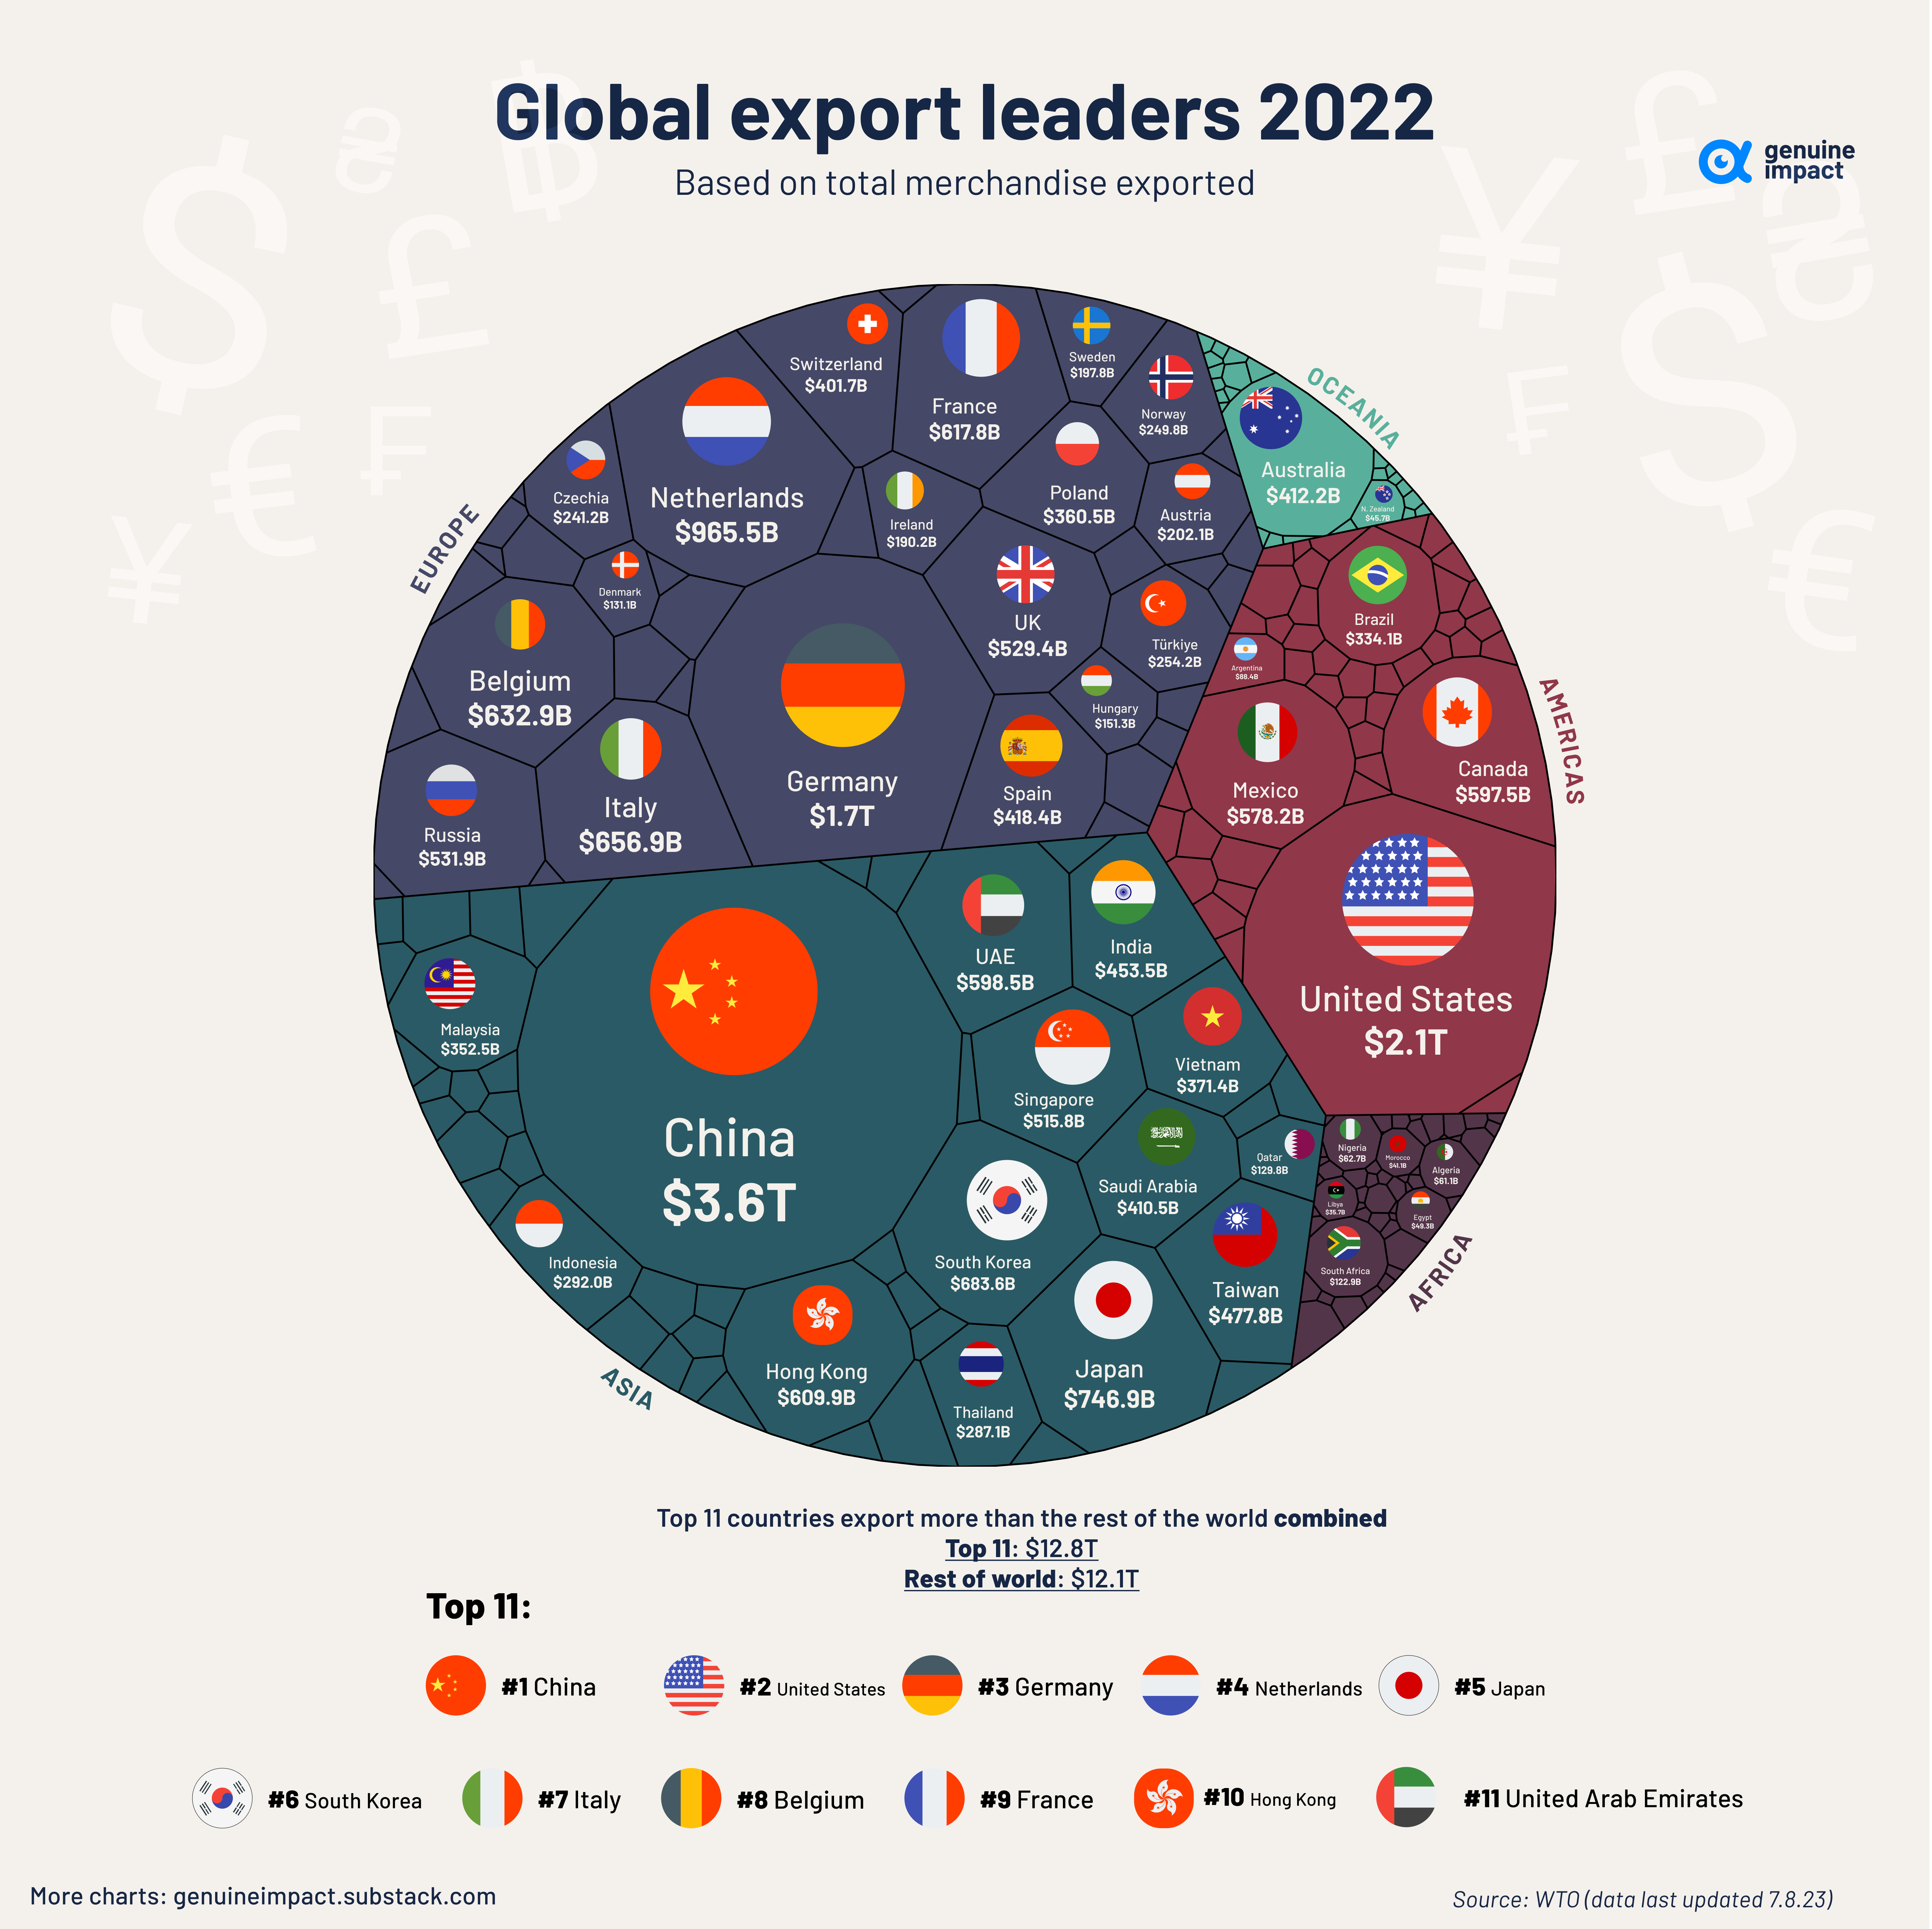
In 2022, the total export value of global goods reached nearly $25 trillion.
With the evolution of international trade, the effects of globalization, and progress in technology, global trade has increased by around 300% over the last 20 years.
This visualization by Truman Du uses data from the World Trade Organization (WTO) to chart the world’s top exporters by country.
China is Still the “World’s Factory”
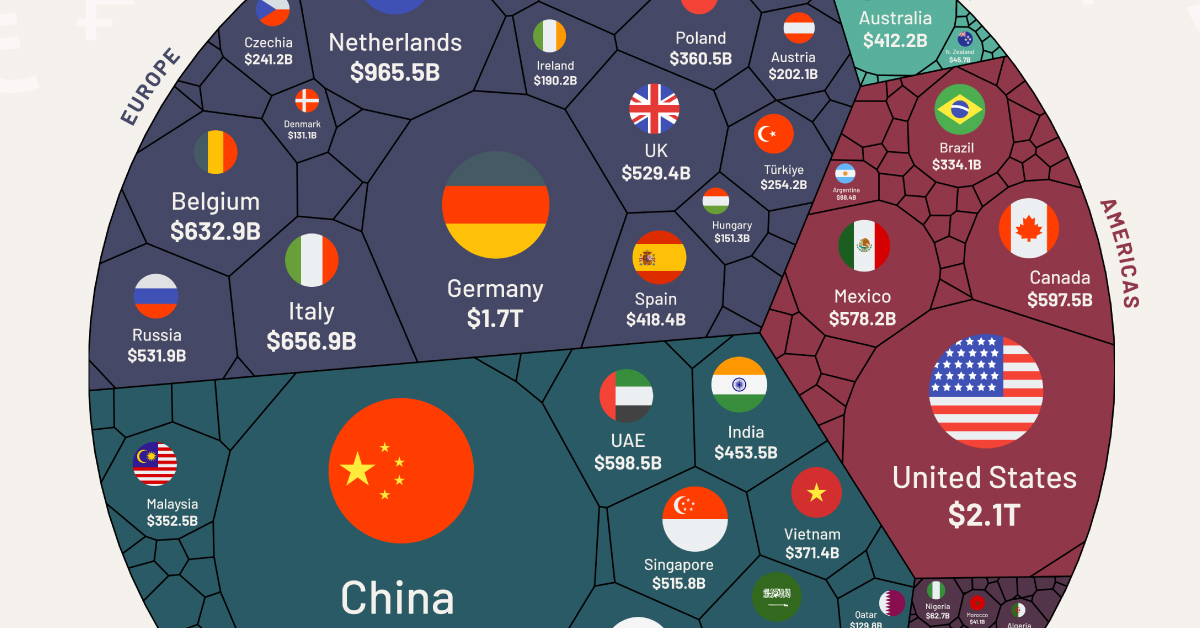
The world’s largest 11 exporters shipped out $12.8 trillion of goods in 2022, more than the rest of the world combined ($12.1 trillion).
The list is headed by China, with $3.6 trillion or 14% of total exports. The country has been the largest exporter of goods in the world since 2009.
| Top 11 | Country | Exports (USD) |
|---|---|---|
| 1 | 🇨🇳 China | $3.6T |
| 2 | 🇺🇸 U.S. | $2.1T |
| 3 | 🇩🇪 Germany | $1.7T |
| 4 | 🇳🇱 Netherlands | $965.5B |
| 5 | 🇯🇵 Japan | $746.9B |
| 6 | 🇰🇷 South Korea | $683.6B |
| 7 | 🇮🇹 Italy | $656.9B |
| 8 | 🇧🇪 Belgium | $632.9B |
| 9 | 🇫🇷 France | $617.8B |
| 10 | 🇭🇰 Hong Kong | $609.9B |
| 11 | 🇦🇪 United Arab Emirates | $598.5B |
In 2022, the top products exported from China by value were phones (including smartphones), computers, optical readers, integrated circuits, solar power diodes, and semiconductors.
Two of China’s primary trading partners are neighboring countries Japan and South Korea.
Mexico Surpasses China as America’s Largest Trading Partner
China has built up significant trade relations with the European Union and the United States, two of the world’s largest markets for goods.
However, recent trade tensions have led to China losing its status as the United States’ biggest trading partner in 2023.
Mexico has now overtaken China as the largest seller to the United States. This shift in trade dynamics is part of a broader effort by the U.S. to import goods from closer to home and reduce its dependence on geopolitical rivals.
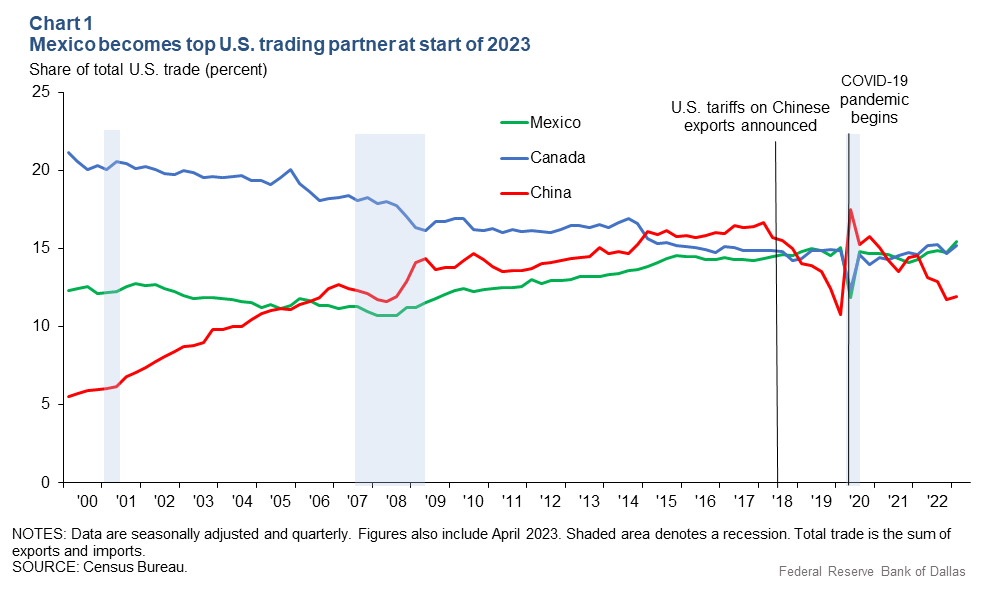
The U.S. itself is the world’s second largest goods exporter, with over $2 trillion annually.
Canada was the largest purchaser of U.S. exports in 2022, accounting for 17% of total exports, followed by Mexico, China, Japan, and the United Kingdom.
The top exports of the United States are refined petroleum, petroleum gas, crude petroleum, cars, and integrated circuits.
The Regional View of Exports by Country
From a regional perspective, it’s clear Asia dominates the trading market with over 36% of the total exports, followed by Europe with 34%.
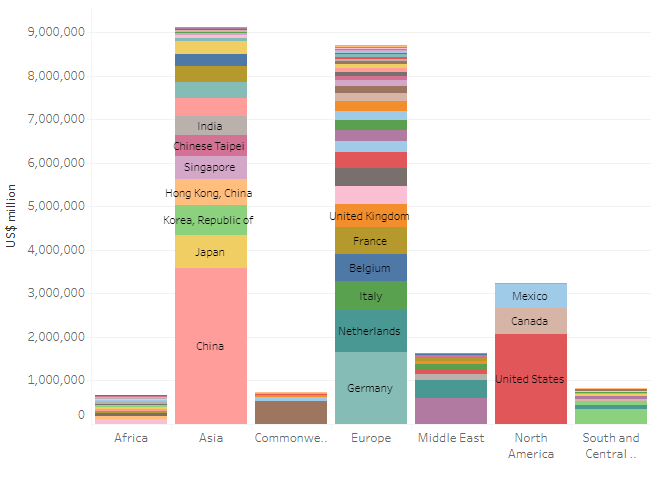
Source: World Trade Organization
While Asian, European, and North American countries have manufactured and technology products among their main exports, African and South American countries mostly export commodities such as oil, gold, diamonds, cocoa, timber, and precious metals.
A New Era of Deglobalization?
International trade grew immensely at the beginning of the 21st century, from $15.6 trillion in 2001 to $40.7 trillion in 2008.
Since then, protectionist trade policies such as taxes on foreign goods and import quotas have increased by 663%. Similarly, global trade as a percent of GDP has also stalled out, peaking in 2008 and going sideways ever since.
Despite many countries reducing their interdependence and integration in the post-COVID era, global exports are still set to grow by 70% between 2020 and 2030, reaching $29.7 trillion by 2030, according to Standard Chartered.

This article was published as a part of Visual Capitalist's Creator Program, which features data-driven visuals from some of our favorite Creators around the world.


Maps
Mapped: The 10 U.S. States With the Lowest Real GDP Growth
In this graphic, we show where real GDP lagged the most across America in 2023 as high interest rates weighed on state economies.


The Top 10 U.S. States, by Lowest Real GDP Growth
This was originally posted on our Voronoi app. Download the app for free on iOS or Android and discover incredible data-driven charts from a variety of trusted sources.
While the U.S. economy defied expectations in 2023, posting 2.5% in real GDP growth, several states lagged behind.
Last year, oil-producing states led the pack in terms of real GDP growth across America, while the lowest growth was seen in states that were more sensitive to the impact of high interest rates, particularly due to slowdowns in the manufacturing and finance sectors.
This graphic shows the 10 states with the least robust real GDP growth in 2023, based on data from the Bureau of Economic Analysis.
Weakest State Economies in 2023
Below, we show the states with the slowest economic activity in inflation-adjusted terms, using chained 2017 dollars:
| Rank | State | Real GDP Growth 2023 YoY | Real GDP 2023 |
|---|---|---|---|
| 1 | Delaware | -1.2% | $74B |
| 2 | Wisconsin | +0.2% | $337B |
| 3 | New York | +0.7% | $1.8T |
| 4 | Missississippi | +0.7% | $115B |
| 5 | Georgia | +0.8% | $661B |
| 6 | Minnesota | +1.2% | $384B |
| 7 | New Hampshire | +1.2% | $91B |
| 8 | Ohio | +1.2% | $698B |
| 9 | Iowa | +1.3% | $200B |
| 10 | Illinois | +1.3% | $876B |
| U.S. | +2.5% | $22.4T |
Delaware witnessed the slowest growth in the country, with real GDP growth of -1.2% over the year as a sluggish finance and insurance sector dampened the state’s economy.
Like Delaware, the Midwestern state of Wisconsin also experienced declines across the finance and insurance sector, in addition to steep drops in the agriculture and manufacturing industries.
America’s third-biggest economy, New York, grew just 0.7% in 2023, falling far below the U.S. average. High interest rates took a toll on key sectors, with notable slowdowns in the construction and manufacturing sectors. In addition, falling home prices and a weaker job market contributed to slower economic growth.
Meanwhile, Georgia experienced the fifth-lowest real GDP growth rate. In March 2024, Rivian paused plans to build a $5 billion EV factory in Georgia, which was set to be one of the biggest economic development initiatives in the state in history.
These delays are likely to exacerbate setbacks for the state, however, both Kia and Hyundai have made significant investments in the EV industry, which could help boost Georgia’s manufacturing sector looking ahead.

-

 Technology1 week ago
Countries With the Highest Rates of Crypto Ownership
-

 Mining6 days ago
Visualizing Copper Production by Country in 2023
-

 Politics7 days ago
Charted: How Americans Feel About Federal Government Agencies
-

 Healthcare1 week ago
Which Countries Have the Highest Infant Mortality Rates?
-

 Demographics1 week ago
Mapped: U.S. Immigrants by Region
-

 Economy1 week ago
Mapped: Southeast Asia’s GDP Per Capita, by Country
-

 Automotive1 week ago
How People Get Around in America, Europe, and Asia
-

 Personal Finance1 week ago
Visualizing the Tax Burden of Every U.S. State