Energy
The Bull Case for Energy Metals Going into 2019
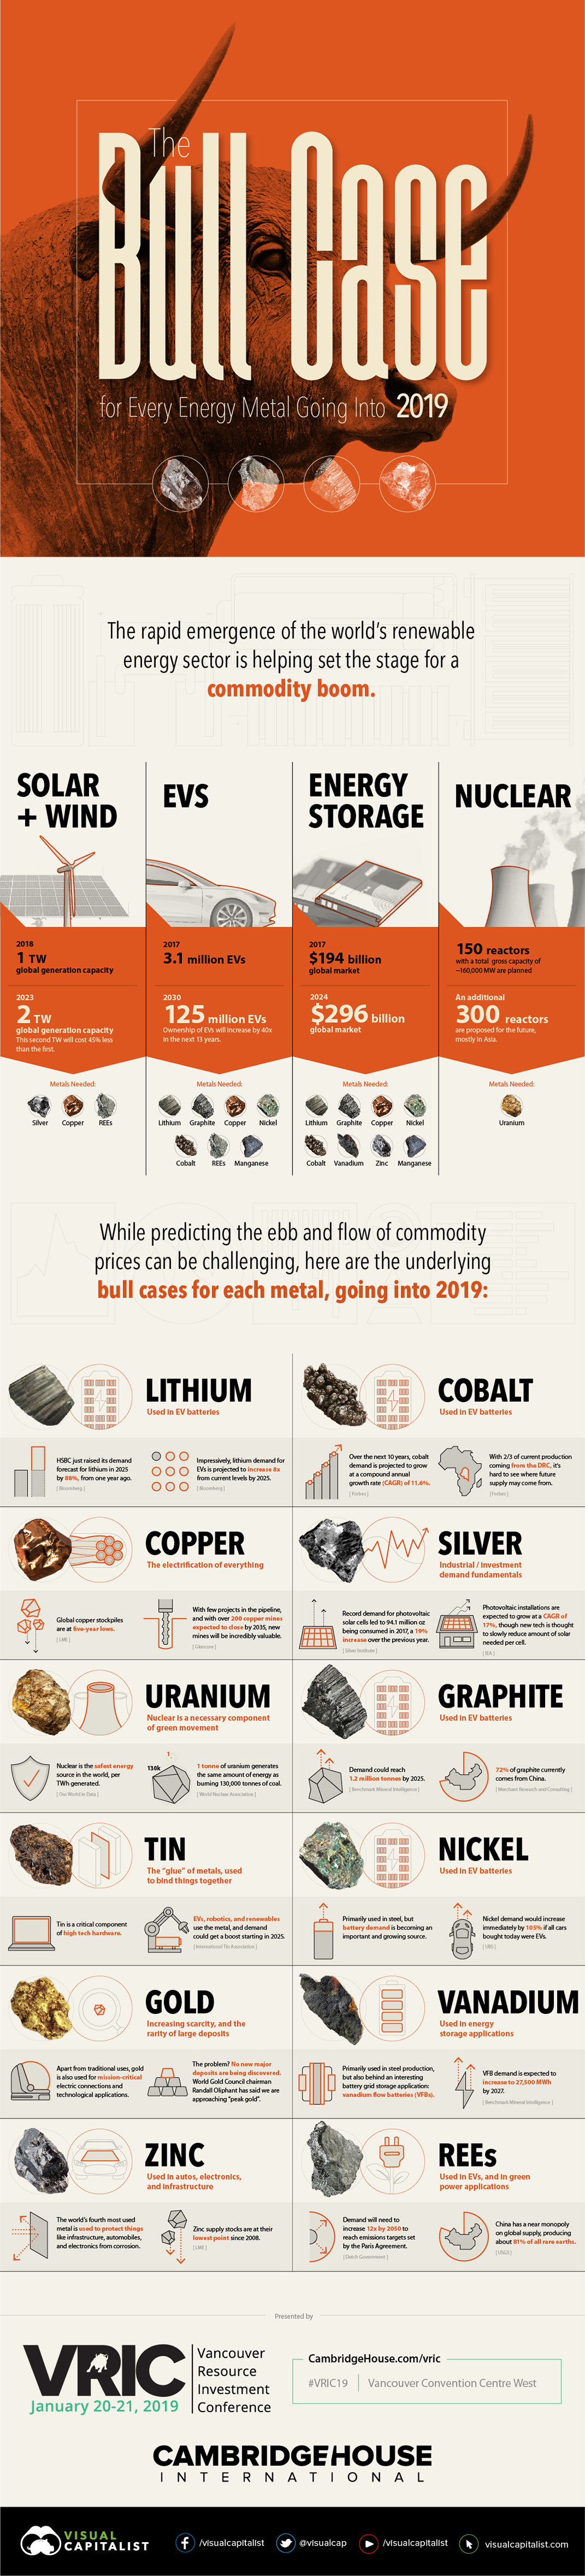
The Bull Case for Every Energy Metal Going into 2019
The rapid emergence of the world’s renewable energy sector is helping set the stage for a commodity boom.
While oil has traditionally been the most interesting commodity to investors in the past, the green energy sector is reliant on the unique electrical and physical properties of many different metals to work optimally.
To build more renewable capacity and to store that energy efficiently, we will need to increase the available supply for these specific raw materials, or face higher costs for each material.
Metal Bull Cases
Ahead of Cambridge House’s annual Vancouver Resource Investment Conference on January 20-21, 2019, we thought it would be prudent to highlight the “bull case” for relevant metals as we start the year.
It’s important to recognize that the commodity market is often cyclical and dependent on a multitude of factors, and that the above cases are not meant to be predictive in any sense.
In other words, the facts and arguments above sum up what we think investors may see as the most compelling stories for these metals – but what actually happens in the market, especially in the short-term, may be different.
Overarching Trends
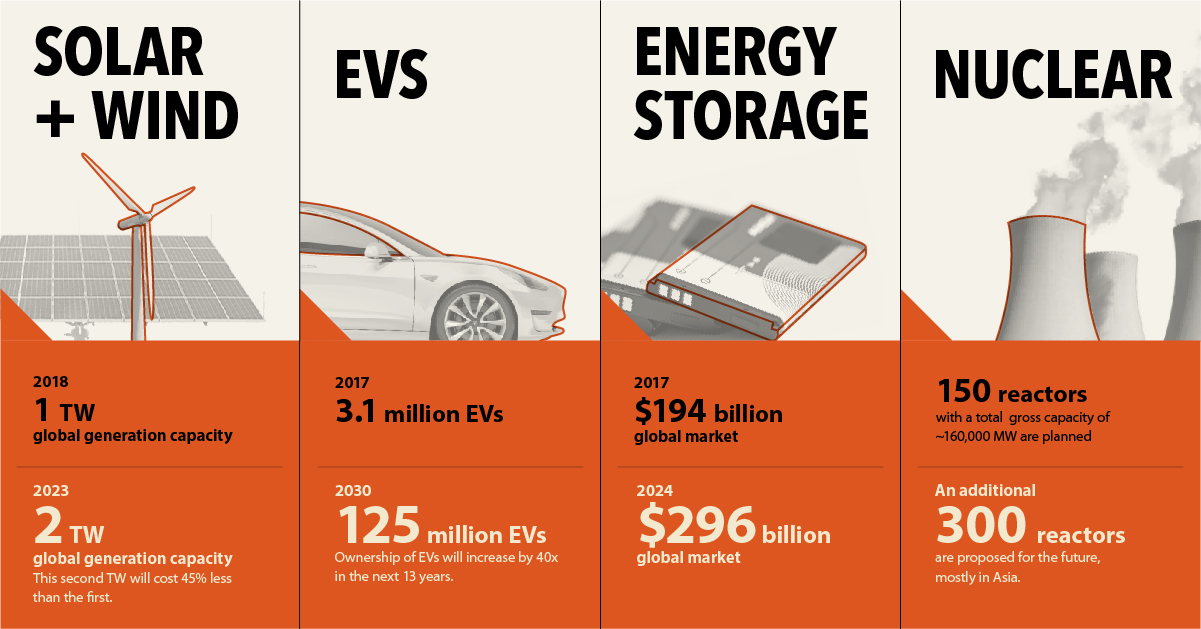
While we highlight 12 minerals ranging from copper to lithium, most of the raw materials in the infographic fit into four overarching, big-picture stories that will drive the future of green energy:
| Story | Supporting Projection |
|---|---|
| Solar and Wind | The world hit 1 TW of wind and solar generation capacity in 2018. The second TW will be up and running by 2023, and will cost 46% less than the first. |
| Electric Vehicles | Ownership of electric vehicles will increase by 40x in the next 13 years, reaching 125 million vehicles in 2030. |
| Energy Storage | The global market for energy storage is rapidly growing, and will leap from $194 billion to $296 billion between 2017-2024. |
| Nuclear | 150 nuclear reactors with a total gross capacity of about 160,000 MW are on order or planned, and about 300 more are proposed – mostly in Asia. |
Which of these stories has the most potential as a catalyst for driving the entire sector?
Based on these narratives, and the individual bull cases above, which metal has the most individual potential?
Let us know in the comments below, or visit Booth #1228 at #VRIC19.


Who’s Building the Most Solar Energy?
This was originally posted on our Voronoi app. Download the app for free on iOS or Android and discover incredible data-driven charts from a variety of trusted sources.
In 2023, solar energy accounted for three-quarters of renewable capacity additions worldwide. Most of this growth occurred in Asia, the EU, and the U.S., continuing a trend observed over the past decade.
In this graphic, we illustrate the rise in installed solar photovoltaic (PV) capacity in China, the EU, and the U.S. between 2010 and 2022, measured in gigawatts (GW). Bruegel compiled the data..
Chinese Dominance
As of 2022, China’s total installed capacity stands at 393 GW, nearly double that of the EU’s 205 GW and surpassing the USA’s total of 113 GW by more than threefold in absolute terms.
| Installed solar capacity (GW) | China | EU27 | U.S. |
|---|---|---|---|
| 2022 | 393.0 | 205.5 | 113.0 |
| 2021 | 307.0 | 162.7 | 95.4 |
| 2020 | 254.0 | 136.9 | 76.4 |
| 2019 | 205.0 | 120.1 | 61.6 |
| 2018 | 175.3 | 104.0 | 52.0 |
| 2017 | 130.8 | 96.2 | 43.8 |
| 2016 | 77.8 | 91.5 | 35.4 |
| 2015 | 43.6 | 87.7 | 24.2 |
| 2014 | 28.4 | 83.6 | 18.1 |
| 2013 | 17.8 | 79.7 | 13.3 |
| 2012 | 6.7 | 71.1 | 8.6 |
| 2011 | 3.1 | 53.3 | 5.6 |
| 2010 | 1.0 | 30.6 | 3.4 |
Since 2017, China has shown a compound annual growth rate (CAGR) of approximately 25% in installed PV capacity, while the USA has seen a CAGR of 21%, and the EU of 16%.
Additionally, China dominates the production of solar power components, currently controlling around 80% of the world’s solar panel supply chain.
In 2022, China’s solar industry employed 2.76 million individuals, with manufacturing roles representing approximately 1.8 million and the remaining 918,000 jobs in construction, installation, and operations and maintenance.
The EU industry employed 648,000 individuals, while the U.S. reached 264,000 jobs.
According to the IEA, China accounts for almost 60% of new renewable capacity expected to become operational globally by 2028.
Despite the phasing out of national subsidies in 2020 and 2021, deployment of solar PV in China is accelerating. The country is expected to reach its national 2030 target for wind and solar PV installations in 2024, six years ahead of schedule.

-

 United States1 week ago
Mapped: Countries Where Recreational Cannabis is Legal
-

 Healthcare2 weeks ago
Life Expectancy by Region (1950-2050F)
-

 Markets2 weeks ago
The Growth of a $1,000 Equity Investment, by Stock Market
-

 Markets2 weeks ago
Mapped: Europe’s GDP Per Capita, by Country
-

 Money2 weeks ago
Charted: What Frustrates Americans About the Tax System
-

 Technology2 weeks ago
Countries With the Highest Rates of Crypto Ownership
-

 Mining2 weeks ago
Where the World’s Aluminum is Smelted, by Country
-

 Personal Finance2 weeks ago
Visualizing the Tax Burden of Every U.S. State