Mapped: The 10 U.S. States With the Lowest Real GDP Growth
Ranked: The World’s 50 Largest Private Equity Firms
Top 10 Countries Most in Debt to the IMF
Ranked: The Top 6 Economies by Share of Global GDP (1980-2024)
Mapped: Europe’s GDP Per Capita, by Country
Countries With the Highest Rates of Crypto Ownership
Mapped: The Number of AI Startups By Country
All of the Grants Given by the U.S. CHIPS Act
Visualizing AI Patents by Country
How Tech Logos Have Evolved Over Time
Visualizing America’s Average Retirement Savings, by Age
Visualizing the Tax Burden of Every U.S. State
Charted: What Frustrates Americans About the Tax System
Ranked: The Top 20 Countries in Debt to China
Mapped: Countries Where Recreational Cannabis is Legal
Which Countries Have the Highest Infant Mortality Rates?
Life Expectancy by Region (1950-2050F)
What Causes Preventable Child Deaths?
The Cost of an EpiPen in Major Markets
Who’s Building the Most Solar Energy?
Mapped: The Age of Energy Projects in Interconnection Queues, by State
Ranked: The Top 10 EV Battery Manufacturers in 2023
The World’s Biggest Nuclear Energy Producers
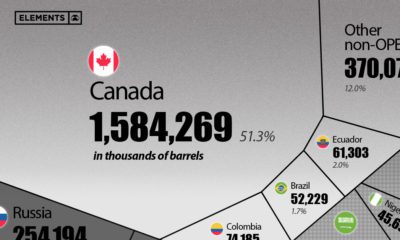
The World’s Biggest Oil Producers in 2023
Mapped: The Top Exports in Asian Countries
Mapped: U.S. States By Number of Cities Over 250,000 Residents
Mapped: U.S. Immigrants by Region
The Biggest Salt Producing Countries in 2023
Visualizing Copper Production by Country in 2023
Where the World’s Aluminum is Smelted, by Country
Visualizing Global Gold Production in 2023
How People Get Around in America, Europe, and Asia
The Carbon Footprint of Major Travel Methods
Ranking the Top 15 Countries by Carbon Tax Revenue
Ranked: The Countries With the Most Air Pollution in 2023
Top Countries By Forest Growth Since 2001
This visualization breaks down U.S. oil imports by country for 2021, showing the split by OPEC and non-OPEC nations.
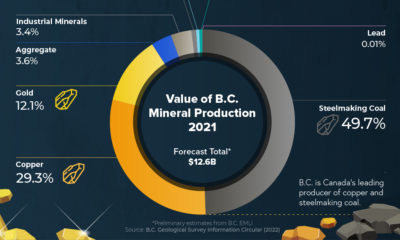
Here are 9 reasons to invest in British Columbia's mining and exploration industry.
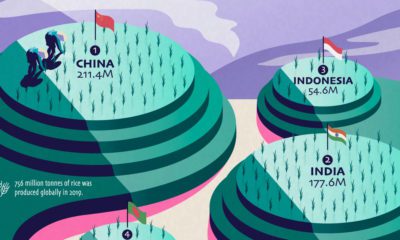
Over half of the world’s population lives on rice as a staple food, but just a few countries dominate global rice production.
Nuclear power accounted for 10% of global electricity generated in 2020. Here's a look at the largest nuclear power producers.
Do you know where your money goes? From travel to gas, we break down Americans’ monthly credit card spending by category.
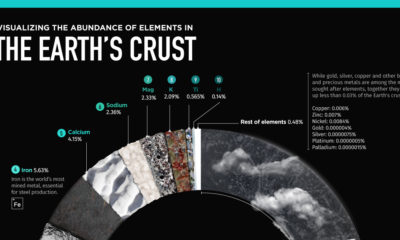
The Earth's crust makes up 1% of the planet's volume, but provides all the material we use. What elements make up this thin layer we stand...
In 2020, solar power saw its largest-ever annual capacity expansion at 127 gigawatts. Here's a snapshot of solar power capacity by country.
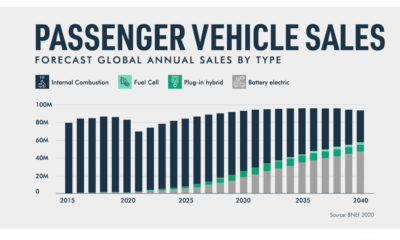
What does the future of commercial and industrial transportation look like? This infographic highlights the electric and driverless future.
The future of the workplace remains uncertain. To set the course, PwC reports reveal five takeaways to help refine recovery strategies.
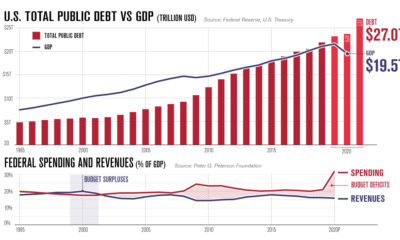
America's debt recently surpassed $27 trillion. In this infographic, we peel back the layers to understand why it keeps on growing.