Mapped: The 10 U.S. States With the Lowest Real GDP Growth
Ranked: The World’s 50 Largest Private Equity Firms
Top 10 Countries Most in Debt to the IMF
Ranked: The Top 6 Economies by Share of Global GDP (1980-2024)
Mapped: Europe’s GDP Per Capita, by Country
Countries With the Highest Rates of Crypto Ownership
Mapped: The Number of AI Startups By Country
All of the Grants Given by the U.S. CHIPS Act
Visualizing AI Patents by Country
How Tech Logos Have Evolved Over Time
Visualizing America’s Average Retirement Savings, by Age
Visualizing the Tax Burden of Every U.S. State
Charted: What Frustrates Americans About the Tax System
Ranked: The Top 20 Countries in Debt to China
Mapped: Countries Where Recreational Cannabis is Legal
Which Countries Have the Highest Infant Mortality Rates?
Life Expectancy by Region (1950-2050F)
What Causes Preventable Child Deaths?
The Cost of an EpiPen in Major Markets
Who’s Building the Most Solar Energy?
Mapped: The Age of Energy Projects in Interconnection Queues, by State
Ranked: The Top 10 EV Battery Manufacturers in 2023
The World’s Biggest Nuclear Energy Producers
The World’s Biggest Oil Producers in 2023
Mapped: The Top Exports in Asian Countries
Mapped: U.S. States By Number of Cities Over 250,000 Residents
Mapped: U.S. Immigrants by Region
The Biggest Salt Producing Countries in 2023
Visualizing Copper Production by Country in 2023
Where the World’s Aluminum is Smelted, by Country
Visualizing Global Gold Production in 2023
How People Get Around in America, Europe, and Asia
The Carbon Footprint of Major Travel Methods
Ranking the Top 15 Countries by Carbon Tax Revenue
Ranked: The Countries With the Most Air Pollution in 2023
Top Countries By Forest Growth Since 2001
From Eli Lilly to Pfizer, this graphic shows the largest pharmaceutical companies around the world by region.
Blue carbon ecosystems are among the most productive in the world. This graphic shows their role in mitigating climate change.
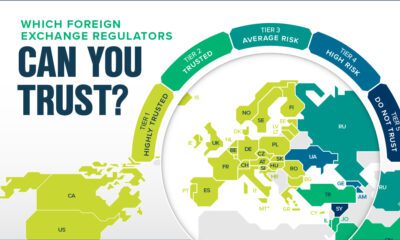
Some foreign exchange regulators have very strict regulations and enforcement, while others have few regulations—or none at all.
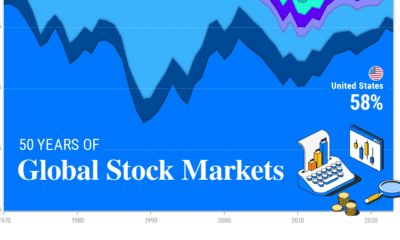
This graphic shows the evolution of global stock markets over modern history—highlighting the outsized influence of the U.S. market.
To offer perspective on the population of U.S. states, this map compares them to countries that share similar population sizes.
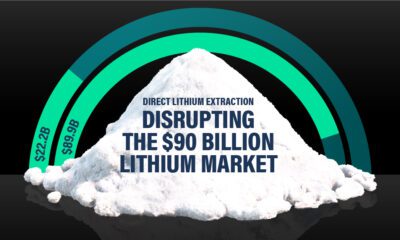
Visual Capitalist and EnergyX explore how direct lithium extraction could disrupt the $90B lithium industry.
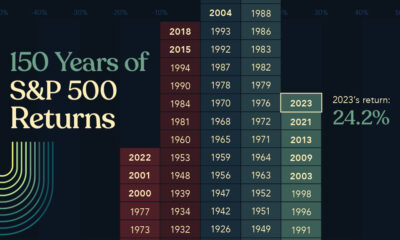
Last year, U.S. stocks took investors by surprise. This graphic shows S&P 500 historical returns since 1875 to put 2023 returns into context.
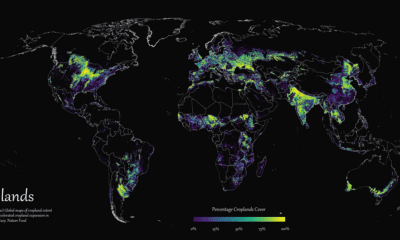
Where are the world's croplands located? This detailed map highlights the world’s cropland cover as of 2019.
From cultural events that dominated headlines to geopolitical shifts and clashes, what major events defined 2023?
This graphic showcases electricity emissions by state, highlighting each state's largest source of power.


 Creator Program