Mapped: The 10 U.S. States With the Lowest Real GDP Growth
Ranked: The World’s 50 Largest Private Equity Firms
Top 10 Countries Most in Debt to the IMF
Ranked: The Top 6 Economies by Share of Global GDP (1980-2024)
Mapped: Europe’s GDP Per Capita, by Country
Countries With the Highest Rates of Crypto Ownership
Mapped: The Number of AI Startups By Country
All of the Grants Given by the U.S. CHIPS Act
Visualizing AI Patents by Country
How Tech Logos Have Evolved Over Time
Visualizing America’s Average Retirement Savings, by Age
Visualizing the Tax Burden of Every U.S. State
Charted: What Frustrates Americans About the Tax System
Ranked: The Top 20 Countries in Debt to China
Mapped: Countries Where Recreational Cannabis is Legal
Which Countries Have the Highest Infant Mortality Rates?
Life Expectancy by Region (1950-2050F)
What Causes Preventable Child Deaths?
The Cost of an EpiPen in Major Markets
Who’s Building the Most Solar Energy?
Mapped: The Age of Energy Projects in Interconnection Queues, by State
Ranked: The Top 10 EV Battery Manufacturers in 2023
The World’s Biggest Nuclear Energy Producers
The World’s Biggest Oil Producers in 2023
Mapped: The Top Exports in Asian Countries
Mapped: U.S. States By Number of Cities Over 250,000 Residents
Mapped: U.S. Immigrants by Region
The Biggest Salt Producing Countries in 2023
Visualizing Copper Production by Country in 2023
Where the World’s Aluminum is Smelted, by Country
Visualizing Global Gold Production in 2023
How People Get Around in America, Europe, and Asia
The Carbon Footprint of Major Travel Methods
Ranking the Top 15 Countries by Carbon Tax Revenue
Ranked: The Countries With the Most Air Pollution in 2023
Top Countries By Forest Growth Since 2001
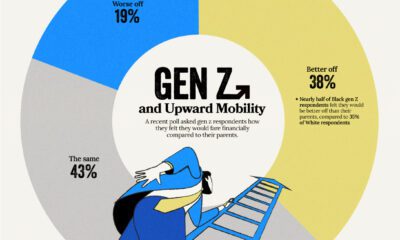
Despite the looming uncertainty, members of Gen Z maintains an optimistic outlook about their financial future
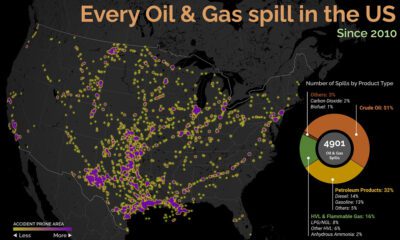
Oil and gas spills can be messy, but where are they most likely to occur? This graphic looks at oil and gas spills in the U.S....
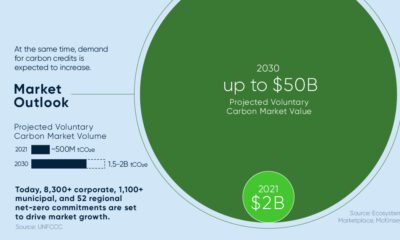
To reach net-zero by 2050, trillions in annual investment will be required. Here’s how carbon credits help close this funding gap.
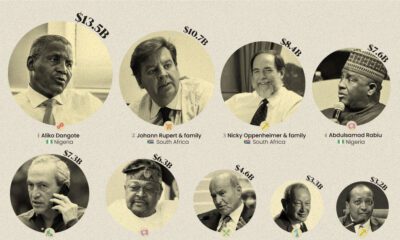
This infographic ranks the wealthiest 15 billionaires on the African continent.
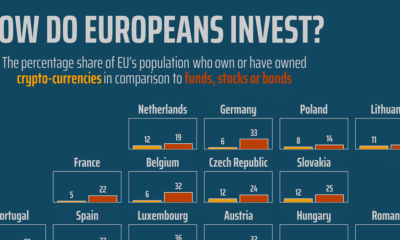
This chart shows crypto popularity amongst European Union investors relative to traditional assets like stocks, bonds, and funds.
Despite having 4% of the world's population, the value of U.S. equities still make up over 40% of the global total.
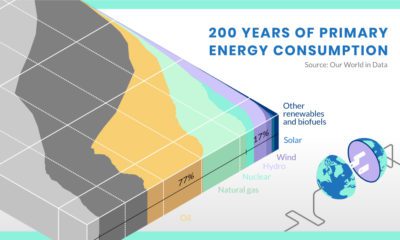
What have energy transitions looked like in the past, and what can we learn from them?
How much oil, coal, and natural gas do we extract each year? See the scale of annual fossil fuel production in perspective.
Prices for our premium memberships will be increasing on Feb 1st. Act now and get VC+ at its current rate.
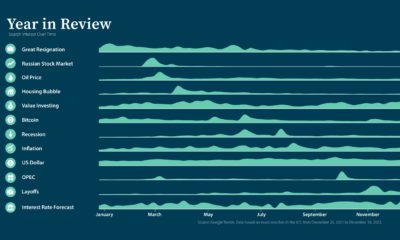
What was on investors' minds in 2022? Discover the top Google searches and how the dominant trends played out in portfolios.


 Creator Program