Markets
Mapped: Inflation Projections by Country, in 2024
![]() See this visualization first on the Voronoi app.
See this visualization first on the Voronoi app.
Inflation Projections, by Country in 2024
This was originally posted on our Voronoi app. Download the app for free on iOS or Android and discover incredible data-driven charts from a variety of trusted sources.
Global economic prospects hang on a delicate balance, largely hinging on the path of inflation.
While inflation looks to be easing, there remains the risk of a second wave of price pressures driven by geopolitical conflicts and supply disruptions in the Red Sea. Adding to this, a stronger than expected labor market could drive consumer demand, pushing up higher prices.
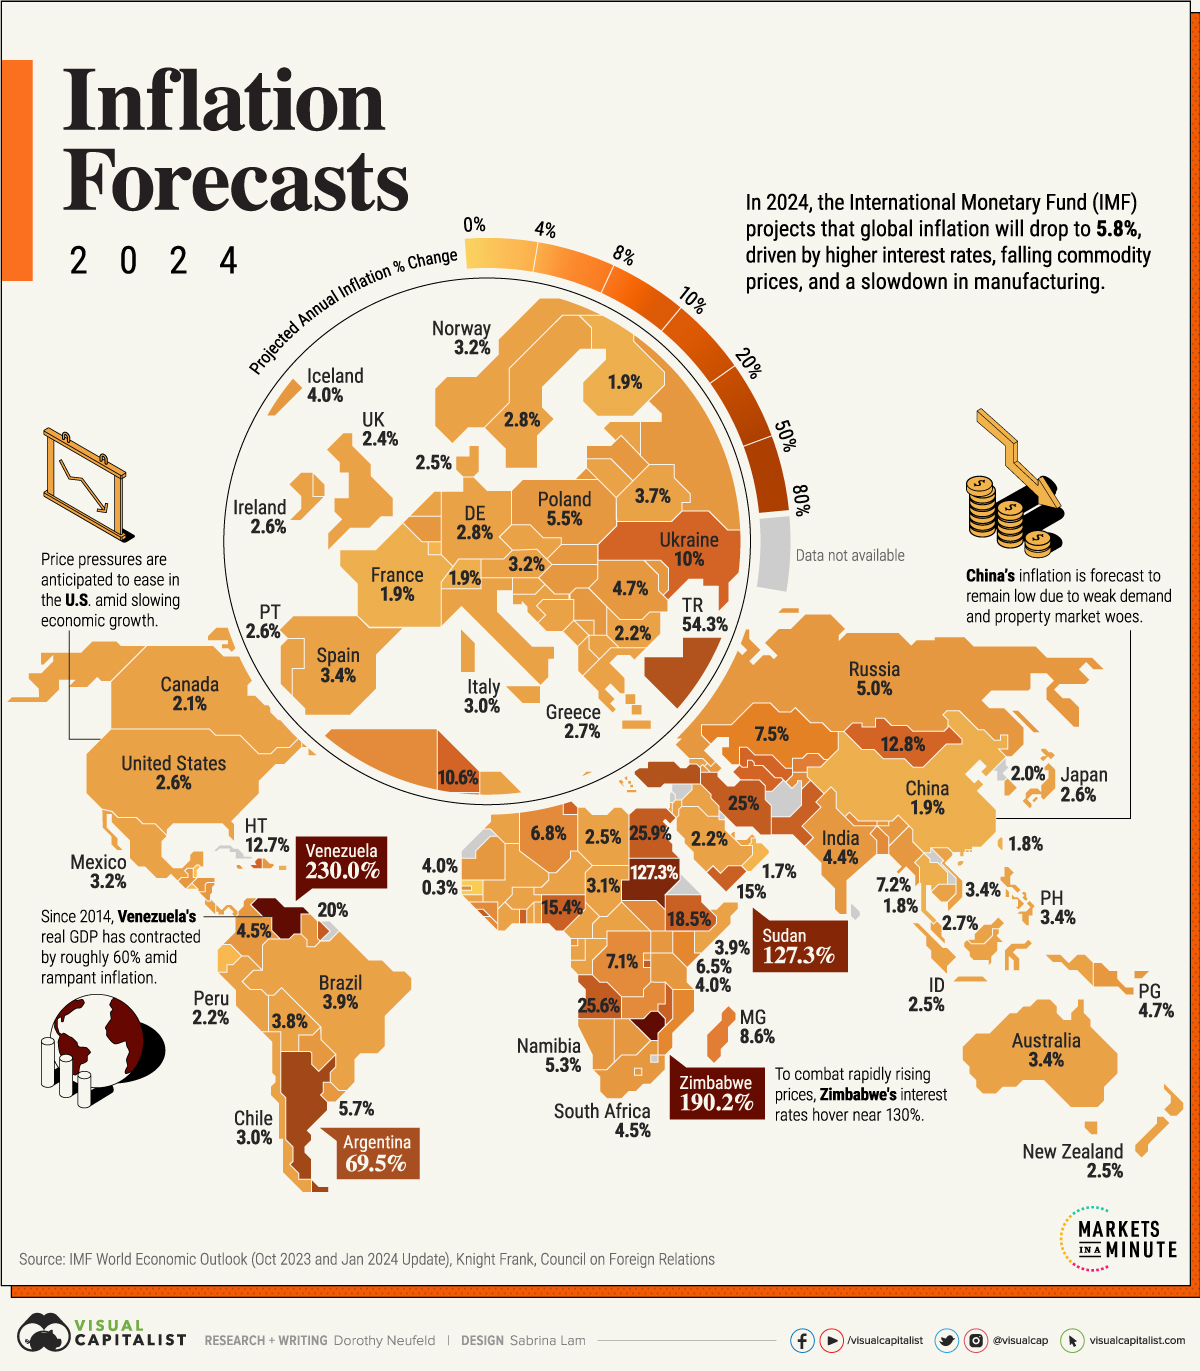
This graphic shows 2024 inflation projections around the world, based on forecasts from the International Monetary Fund (IMF).
Is Global Inflation On a Downward Path?
In 2024, global inflation is projected to decline to 5.8%, down from a 6.8% estimated annual average in 2023.
Tighter monetary policy and falling energy prices are forecast to dampen price pressures alongside a cooling labor market. Below, we show inflation projections across 190 countries:
| Country | Projected Annual Inflation Change 2024 |
|---|---|
| 🇻🇪 Venezuela | 230.0% |
| 🇿🇼 Zimbabwe | 190.2% |
| 🇸🇩 Sudan | 127.3% |
| 🇦🇷 Argentina | 69.5% |
| 🇹🇷 Türkiye | 54.3% |
| 🇪🇬 Egypt | 25.9% |
| 🇦🇴 Angola | 25.6% |
| 🇮🇷 Iran | 25.0% |
| 🇧🇮 Burundi | 22.4% |
| 🇸🇱 Sierra Leone | 21.7% |
| 🇸🇷 Suriname | 20.0% |
| 🇪🇹 Ethiopia | 18.5% |
| 🇵🇰 Pakistan | 17.5% |
| 🇳🇬 Nigeria | 15.4% |
| 🇲🇼 Malawi | 15.2% |
| 🇬🇭 Ghana | 15.0% |
| 🇾🇪 Yemen | 15.0% |
| 🇲🇳 Mongolia | 12.8% |
| 🇭🇹 Haiti | 12.7% |
| 🇺🇿 Uzbekistan | 10.7% |
| 🇹🇳 Tunisia | 10.6% |
| 🇹🇲 Turkmenistan | 10.0% |
| 🇺🇦 Ukraine | 10.0% |
| 🇲🇬 Madagascar | 8.6% |
| 🇰🇬 Kyrgyz Republic | 8.0% |
| 🇿🇲 Zambia | 7.9% |
| 🇲🇺 Mauritius | 7.8% |
| 🇬🇳 Guinea | 7.8% |
| 🇰🇿 Kazakhstan | 7.5% |
| 🇧🇩 Bangladesh | 7.2% |
| 🇲🇲 Myanmar | 7.2% |
| 🇸🇹 São Tomé and Príncipe | 7.2% |
| 🇬🇲 The Gambia | 7.1% |
| 🇨🇩 Democratic Republic of the Congo | 7.1% |
| 🇩🇿 Algeria | 6.8% |
| 🇹🇯 Tajikistan | 6.5% |
| 🇳🇵 Nepal | 6.5% |
| 🇰🇪 Kenya | 6.5% |
| 🇲🇿 Mozambique | 6.5% |
| 🇹🇴 Tonga | 6.2% |
| 🇸🇸 South Sudan | 6.1% |
| 🇱🇷 Liberia | 6.0% |
| 🇺🇾 Uruguay | 5.7% |
| 🇻🇺 Vanuatu | 5.6% |
| 🇵🇱 Poland | 5.5% |
| 🇬🇾 Guyana | 5.5% |
| 🇷🇼 Rwanda | 5.5% |
| 🇭🇺 Hungary | 5.4% |
| 🇳🇦 Namibia | 5.3% |
| 🇬🇶 Equatorial Guinea | 5.2% |
| 🇧🇹 Bhutan | 5.1% |
| 🇦🇿 Azerbaijan | 5.0% |
| 🇯🇲 Jamaica | 5.0% |
| 🇱🇸 Lesotho | 5.0% |
| 🇲🇩 Moldova | 5.0% |
| 🇷🇺 Russia | 5.0% |
| 🇺🇬 Uganda | 5.0% |
| 🇳🇮 Nicaragua | 4.8% |
| 🇵🇬 Papua New Guinea | 4.7% |
| 🇷🇴 Romania | 4.7% |
| 🇬🇹 Guatemala | 4.6% |
| 🇼🇸 Samoa | 4.5% |
| 🇿🇦 South Africa | 4.5% |
| 🇸🇰 Slovak Republic | 4.5% |
| 🇨🇴 Colombia | 4.5% |
| 🇮🇳 India | 4.4% |
| 🇧🇼 Botswana | 4.4% |
| 🇸🇿 Eswatini | 4.3% |
| 🇱🇻 Latvia | 4.3% |
| 🇭🇳 Honduras | 4.2% |
| 🇳🇷 Nauru | 4.2% |
| 🇧🇪 Belgium | 4.0% |
| 🇮🇸 Iceland | 4.0% |
| 🇹🇿 Tanzania | 4.0% |
| 🇰🇮 Kiribati | 4.0% |
| 🇲🇷 Mauritania | 4.0% |
| 🇵🇾 Paraguay | 4.0% |
| 🇷🇸 Serbia | 4.0% |
| 🇩🇴 Dominican Republic | 4.0% |
| 🇦🇲 Armenia | 4.0% |
| 🇧🇷 Brazil | 3.9% |
| 🇸🇴 Somalia | 3.9% |
| 🇹🇻 Tuvalu | 3.8% |
| 🇧🇴 Bolivia | 3.8% |
| 🇧🇾 Belarus | 3.7% |
| 🇨🇲 Cameroon | 3.7% |
| 🇽🇰 Kosovo | 3.7% |
| 🇪🇪 Estonia | 3.6% |
| 🇧🇧 Barbados | 3.6% |
| 🇸🇧 Solomon Islands | 3.6% |
| 🇦🇱 Albania | 3.6% |
| 🇦🇺 Australia | 3.4% |
| 🇪🇸 Spain | 3.4% |
| 🇵🇭 Philippines | 3.4% |
| 🇻🇳 Vietnam | 3.4% |
| 🇲🇦 Morocco | 3.3% |
| 🇸🇮 Slovenia | 3.3% |
| 🇦🇹 Austria | 3.2% |
| 🇭🇷 Croatia | 3.2% |
| 🇨🇬 Republic of Congo | 3.2% |
| 🇳🇴 Norway | 3.2% |
| 🇸🇬 Singapore | 3.2% |
| 🇲🇽 Mexico | 3.2% |
| 🇹🇩 Chad | 3.1% |
| 🇲🇪 Montenegro | 3.1% |
| 🇱🇹 Lithuania | 3.1% |
| 🇨🇷 Costa Rica | 3.0% |
| 🇰🇭 Cambodia | 3.0% |
| 🇮🇹 Italy | 3.0% |
| 🇨🇱 Chile | 3.0% |
| 🇬🇪 Georgia | 3.0% |
| 🇬🇼 Guinea-Bissau | 3.0% |
| 🇮🇶 Iraq | 3.0% |
| 🇱🇦 Lao P.D.R. | 3.0% |
| 🇫🇲 Micronesia | 3.0% |
| 🇩🇲 Dominica | 2.9% |
| 🇸🇪 Sweden | 2.8% |
| 🇩🇪 Germany | 2.8% |
| 🇬🇷 Greece | 2.7% |
| 🇲🇾 Malaysia | 2.7% |
| 🇮🇪 Ireland | 2.6% |
| 🇯🇵 Japan | 2.6% |
| 🇫🇯 Fiji | 2.6% |
| 🇲🇭 Marshall Islands | 2.6% |
| 🇬🇩 Grenada | 2.6% |
| 🇺🇸 United States | 2.6% |
| 🇵🇹 Portugal | 2.6% |
| 🇮🇱 Israel | 2.6% |
| 🇧🇸 The Bahamas | 2.6% |
| 🇯🇴 Jordan | 2.6% |
| 🇱🇾 Libya | 2.5% |
| 🇳🇿 New Zealand | 2.5% |
| 🇧🇯 Benin | 2.5% |
| 🇩🇰 Denmark | 2.5% |
| 🇩🇯 Djibouti | 2.5% |
| 🇸🇲 San Marino | 2.5% |
| 🇹🇱 Timor-Leste | 2.5% |
| 🇮🇩 Indonesia | 2.5% |
| 🇦🇬 Antigua and Barbuda | 2.5% |
| 🇳🇪 Niger | 2.5% |
| 🇨🇫 Central African Republic | 2.5% |
| 🇵🇸 West Bank and Gaza | 2.5% |
| 🇲🇻 Maldives | 2.4% |
| 🇲🇹 Malta | 2.4% |
| 🇳🇱 Netherlands | 2.4% |
| 🇸🇨 Seychelles | 2.4% |
| 🇬🇧 United Kingdom | 2.4% |
| 🇬🇦 Gabon | 2.4% |
| 🇰🇳 St. Kitts and Nevis | 2.3% |
| 🇭🇰 Hong Kong SAR | 2.3% |
| 🇲🇰 North Macedonia | 2.3% |
| 🇦🇪 UAE | 2.3% |
| 🇹🇹 Trinidad and Tobago | 2.3% |
| 🇶🇦 Qatar | 2.3% |
| 🇵🇦 Panama | 2.2% |
| 🇸🇦 Saudi Arabia | 2.2% |
| 🇵🇪 Peru | 2.2% |
| 🇨🇾 Cyprus | 2.2% |
| 🇨🇿 Czech Republic | 2.2% |
| 🇹🇬 Togo | 2.2% |
| 🇧🇬 Bulgaria | 2.2% |
| 🇦🇼 Aruba | 2.2% |
| 🇨🇦 Canada | 2.1% |
| 🇧🇦 Bosnia and Herzegovina | 2.1% |
| 🇱🇨 St. Lucia | 2.1% |
| 🇦🇩 Andorra | 2.0% |
| 🇧🇫 Burkina Faso | 2.0% |
| 🇨🇻 Cabo Verde | 2.0% |
| 🇨🇮 Côte d'Ivoire | 2.0% |
| 🇰🇷 Korea | 2.0% |
| 🇲🇱 Mali | 2.0% |
| 🇻🇨 St. Vincent and the Grenadines | 2.0% |
| 🇨🇭 Switzerland | 1.9% |
| 🇵🇷 Puerto Rico | 1.9% |
| 🇨🇳 China | 1.9% |
| 🇫🇮 Finland | 1.9% |
| 🇫🇷 France | 1.9% |
| 🇹🇼 Taiwan | 1.8% |
| 🇵🇼 Palau | 1.8% |
| 🇹🇭 Thailand | 1.8% |
| 🇱🇺 Luxembourg | 1.7% |
| 🇸🇻 El Salvador | 1.7% |
| 🇲🇴 Macao SAR | 1.7% |
| 🇴🇲 Oman | 1.7% |
| 🇰🇲 Comoros | 1.6% |
| 🇧🇳 Brunei Darussalam | 1.5% |
| 🇪🇨 Ecuador | 1.5% |
| 🇧🇭 Bahrain | 1.4% |
| 🇧🇿 Belize | 1.2% |
| 🇸🇳 Senegal | 0.3% |
Venezuela, with the largest oil reserves globally, is projected to see inflation reach 230%—the highest overall.
Across the last decade, the country has faced hyperinflation, reaching a stunning 10 million percent in 2019. Since U.S. sanctions were lifted last year, inflation has fallen dramatically due to sharp cuts in government spending and increasing dollarization of the economy, which is bolstering the bolivar.
In America, slower economic growth coupled with a softening labor market could ease inflation, which is forecast to reach 2.6% in 2024. While the Federal Reserve has signaled that the worst is over, unexpected momentum across the economy could cloud the outcome. As of November 2023, $290 billion in excess savings were held across American households, which may continue to spur consumer demand.
Over in Europe, inflation is anticipated to average 3.3% across advanced economies. Today, sinking natural gas prices and low GDP growth are keeping inflation expectations at bay.
China, the world’s second-largest economy, is contending with falling prices due to property market trouble, which drives about a third of the country’s economic growth. Amid sluggish economic activity, a manufacturing slowdown, and low consumer confidence, inflation is forecast to reach 1.7%.
What Could Cause Inflation to Re-Accelerate?
While inflation shocks driven from the pandemic appear to be over, key risks could drive up inflation:
- Geopolitical Pressures: Rising shipping costs due to the conflict in the Middle East and Red Sea could continue to escalate and energy prices could increase amid disrupted supply, driving inflation higher.
- Strong Consumer Demand: Accumulated excess savings could continue to fuel economies, leading central banks to remain hawkish. Persistently high wage growth—which increased about double the pre-pandemic average across advanced nations in 2023—could boost consumption and higher prices.
- Rising Housing Costs: Shelter makes up about a third of the Consumer Price Index, the biggest component overall. If prices accelerate, it presents key inflationary risks. As of January 2024, U.S. shelter costs increased 6% annually.
So far, the global economy has been resilient. While risk factors remain, inflation projections suggest that the path towards a 2% target is slow, but going in the right direction.


Maps
Mapped: The 10 U.S. States With the Lowest Real GDP Growth
In this graphic, we show where real GDP lagged the most across America in 2023 as high interest rates weighed on state economies.


The Top 10 U.S. States, by Lowest Real GDP Growth
This was originally posted on our Voronoi app. Download the app for free on iOS or Android and discover incredible data-driven charts from a variety of trusted sources.
While the U.S. economy defied expectations in 2023, posting 2.5% in real GDP growth, several states lagged behind.
Last year, oil-producing states led the pack in terms of real GDP growth across America, while the lowest growth was seen in states that were more sensitive to the impact of high interest rates, particularly due to slowdowns in the manufacturing and finance sectors.
This graphic shows the 10 states with the least robust real GDP growth in 2023, based on data from the Bureau of Economic Analysis.
Weakest State Economies in 2023
Below, we show the states with the slowest economic activity in inflation-adjusted terms, using chained 2017 dollars:
| Rank | State | Real GDP Growth 2023 YoY | Real GDP 2023 |
|---|---|---|---|
| 1 | Delaware | -1.2% | $74B |
| 2 | Wisconsin | +0.2% | $337B |
| 3 | New York | +0.7% | $1.8T |
| 4 | Missississippi | +0.7% | $115B |
| 5 | Georgia | +0.8% | $661B |
| 6 | Minnesota | +1.2% | $384B |
| 7 | New Hampshire | +1.2% | $91B |
| 8 | Ohio | +1.2% | $698B |
| 9 | Iowa | +1.3% | $200B |
| 10 | Illinois | +1.3% | $876B |
| U.S. | +2.5% | $22.4T |
Delaware witnessed the slowest growth in the country, with real GDP growth of -1.2% over the year as a sluggish finance and insurance sector dampened the state’s economy.
Like Delaware, the Midwestern state of Wisconsin also experienced declines across the finance and insurance sector, in addition to steep drops in the agriculture and manufacturing industries.
America’s third-biggest economy, New York, grew just 0.7% in 2023, falling far below the U.S. average. High interest rates took a toll on key sectors, with notable slowdowns in the construction and manufacturing sectors. In addition, falling home prices and a weaker job market contributed to slower economic growth.
Meanwhile, Georgia experienced the fifth-lowest real GDP growth rate. In March 2024, Rivian paused plans to build a $5 billion EV factory in Georgia, which was set to be one of the biggest economic development initiatives in the state in history.
These delays are likely to exacerbate setbacks for the state, however, both Kia and Hyundai have made significant investments in the EV industry, which could help boost Georgia’s manufacturing sector looking ahead.

-

 United States1 week ago
Mapped: Countries Where Recreational Cannabis is Legal
-

 Healthcare2 weeks ago
Life Expectancy by Region (1950-2050F)
-

 Markets2 weeks ago
The Growth of a $1,000 Equity Investment, by Stock Market
-

 Markets2 weeks ago
Mapped: Europe’s GDP Per Capita, by Country
-

 Money2 weeks ago
Charted: What Frustrates Americans About the Tax System
-

 Technology2 weeks ago
Countries With the Highest Rates of Crypto Ownership
-

 Mining2 weeks ago
Where the World’s Aluminum is Smelted, by Country
-

 Personal Finance2 weeks ago
Visualizing the Tax Burden of Every U.S. State