The Start of De-Dollarization: China’s Gradual Move Away from the USD


The Start of De-Dollarization: China’s Move Away from the USD
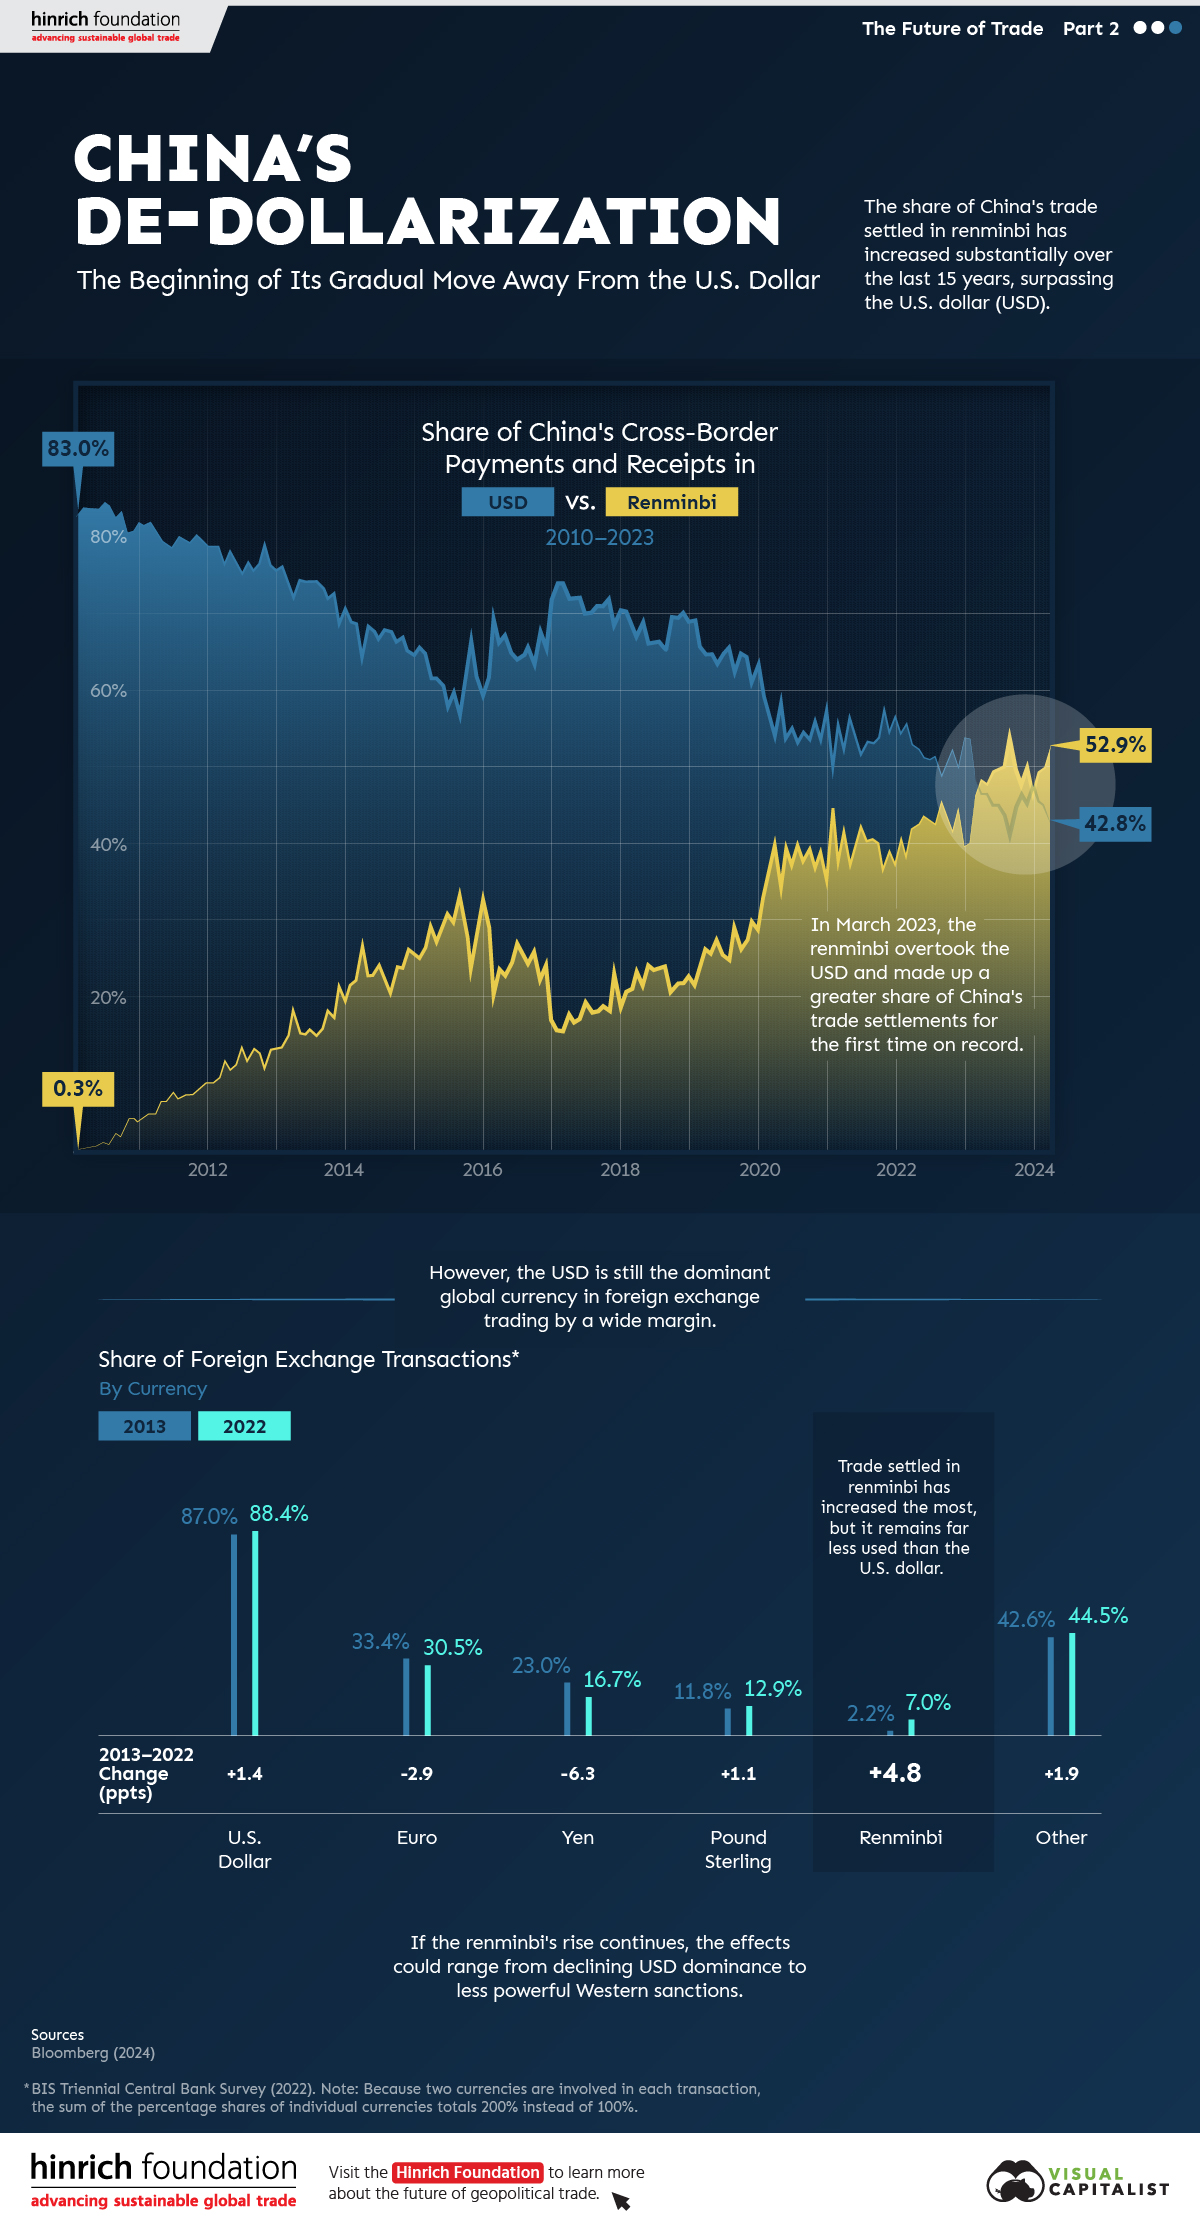
Since 2010, the majority of China’s cross-border payments, like those of many countries, have been settled in U.S. dollars (USD). As of the first quarter of 2023, that’s no longer the case.
This graphic from the Hinrich Foundation, the second in a three-part series covering the future of trade, provides visual context to the growing use of the Chinese renminbi (RMB) in payments both domestically and globally.
The De-Dollarization of China’s Cross-Border Transactions
This analysis uses Bloomberg data on the share of China’s payments and receipts in RMB, USD, and other currencies from 2010 to 2024.
In the first few months of 2010, settlements in local currency accounted for less than 1.0% of China’s cross-border payments, compared to approximately 83.0% in USD.
China has since closed that gap. In March 2023, the share of the RMB in China’s settlements surpassed the USD for the first time.
| Date | Renminbi | U.S. Dollar | Other |
|---|---|---|---|
| March 2010 | 0.3% | 84.3% | 15.4% |
| March 2011 | 4.8% | 81.3% | 13.9% |
| March 2012 | 11.5% | 77.1% | 11.5% |
| March 2013 | 18.1% | 72.7% | 9.2% |
| March 2014 | 26.6% | 64.8% | 8.6% |
| March 2015 | 29.0% | 61.9% | 9.0% |
| March 2016 | 23.6% | 66.7% | 9.7% |
| March 2017 | 17.6% | 72.5% | 9.9% |
| March 2018 | 23.2% | 67.4% | 9.4% |
| March 2019 | 26.2% | 65.1% | 8.7% |
| March 2020 | 39.3% | 54.4% | 6.3% |
| March 2021 | 41.7% | 52.6% | 5.6% |
| March 2022 | 42.1% | 53.3% | 4.7% |
| March 2023 | 48.4% | 46.7% | 4.9% |
| March 2024 | 52.9% | 42.8% | 4.3% |
Source: Bloomberg (2024)
Since then, the de-dollarization in Chinese international settlements has continued.
As of March 2024, over half (52.9%) of Chinese payments were settled in RMB while 42.8% were settled in USD. This is double the share from five years previous. According to Goldman Sachs, foreigners’ increased willingness to trade assets denominated in RMB significantly contributed to de-dollarization in favor of China’s currency. Also, early last year, Brazil and Argentina announced that they would begin allowing trade settlements in RMB.
Most Popular Currencies in Foreign Exchange (FX) Transactions
Globally, analysis from the Bank for International Settlements reveals that, in 2022, the USD remained the most-used currency for FX settlements. The euro and the Japanese yen came in second and third, respectively.
| Currency | 2013 | 2022 | Change (pp) |
|---|---|---|---|
| U.S. Dollar | 87.0% | 88.5% | +1.5 |
| Euro | 33.4% | 30.5% | -2.9 |
| Yen | 23.0% | 16.7% | -6.3 |
| Pound Sterling | 11.8% | 12.9% | +1.1 |
| Renminbi | 2.2% | 7.0% | +4.8 |
| Other | 42.6% | 44.4% | +1.8 |
| Total | 200.0% | 200.0% |
Source: BIS Triennial Central Bank Survey (2022). Because two currencies are involved in each transaction, the sum of the percentage shares of individual currencies totals 200% instead of 100%.
The Chinese renminbi, though accounting for a relatively small share of FX transactions, gained the most ground over the last decade. Meanwhile, the euro and the yen saw decreases in use.
The Future of De-Dollarization
If the RMB’s global rise continues, the stranglehold of the USD on international trade could diminish over time.
The impacts of declining dollar dominance are complex and uncertain, but they could range from the underperformance of U.S. financial assets to diminished power of Western sanctions.
However, though the prevalence of RMB in international payments could rise, a complete de-dollarization of the world economy in the near- or medium-term is unlikely. China’s strict capital controls that limit the availability of RMB outside the country, and the nation’s sputtering economic growth, are key reasons contributing to this.
The third piece in this series will explore Russia’s shifting trading patterns following its invasion of Ukraine.
Visit the Hinrich Foundation to learn more about the future of geopolitical trade

-

 Politics1 day ago
Ranked: Countries with the Most Embassies Around the World
The Global Diplomacy Index attempts to quantify and compare diplomatic networks by ranking countries with the most embassies worldwide.
-

 United States1 week ago
Mapped: Unauthorized Immigrants by State
Three states concentrate almost half of unauthorized immigrants.
-
 Maps2 weeks ago
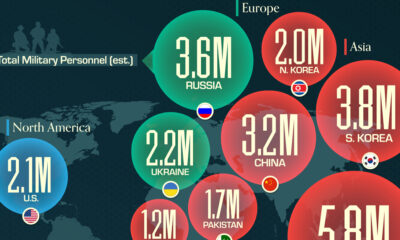
Mapped: The World’s Largest Armies in 2024
Vietnam, India, and South Korea top the list.
-

 China4 weeks ago
Which Countries Have the Most Economic Influence in Southeast Asia?
One country dominates this survey of who has the most economic influence in the region.
-

 Politics1 month ago
Charted: How Democrats and Republicans View Government Agencies
Predictably, results diverge when both Democrats and Republicans are asked to rate key government agencies in the United States.
-

 War1 month ago
Visualized: Aircraft Carriers by Country
The U.S. controls 40% of global aircraft carrier fleet.