Mapped: The 10 U.S. States With the Lowest Real GDP Growth
Ranked: The World’s 50 Largest Private Equity Firms
Top 10 Countries Most in Debt to the IMF
Ranked: The Top 6 Economies by Share of Global GDP (1980-2024)
Mapped: Europe’s GDP Per Capita, by Country
Countries With the Highest Rates of Crypto Ownership
Mapped: The Number of AI Startups By Country
All of the Grants Given by the U.S. CHIPS Act
Visualizing AI Patents by Country
How Tech Logos Have Evolved Over Time
Visualizing America’s Average Retirement Savings, by Age
Visualizing the Tax Burden of Every U.S. State
Charted: What Frustrates Americans About the Tax System
Ranked: The Top 20 Countries in Debt to China
Mapped: Countries Where Recreational Cannabis is Legal
Which Countries Have the Highest Infant Mortality Rates?
Life Expectancy by Region (1950-2050F)
What Causes Preventable Child Deaths?
The Cost of an EpiPen in Major Markets
Who’s Building the Most Solar Energy?
Mapped: The Age of Energy Projects in Interconnection Queues, by State
Ranked: The Top 10 EV Battery Manufacturers in 2023
The World’s Biggest Nuclear Energy Producers
The World’s Biggest Oil Producers in 2023
Mapped: The Top Exports in Asian Countries
Mapped: U.S. States By Number of Cities Over 250,000 Residents
Mapped: U.S. Immigrants by Region
The Biggest Salt Producing Countries in 2023
Visualizing Copper Production by Country in 2023
Where the World’s Aluminum is Smelted, by Country
Visualizing Global Gold Production in 2023
How People Get Around in America, Europe, and Asia
The Carbon Footprint of Major Travel Methods
Ranking the Top 15 Countries by Carbon Tax Revenue
Ranked: The Countries With the Most Air Pollution in 2023
Top Countries By Forest Growth Since 2001
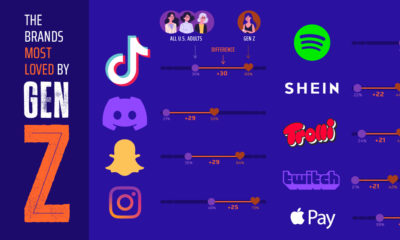
Which brands win the most with Gen Z compared to older generations? From TikTok to Capri Sun, this ranking looks at Gen Z's favorite brands.
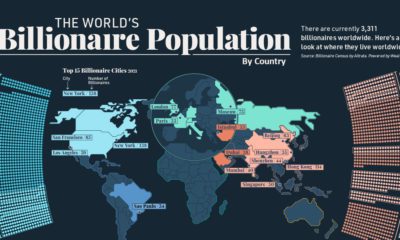
Collectively, worldwide billionaire wealth is nearly $12 trillion. This map breaks down where these 3,311 billionaires live around the globe.
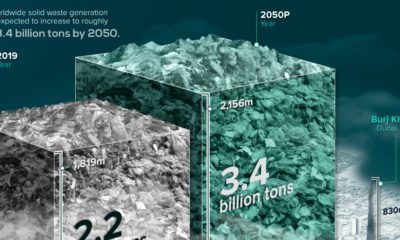
Waste generation is expected to jump over the next 30 years. See global waste visualized over this time period, along with waste per person.
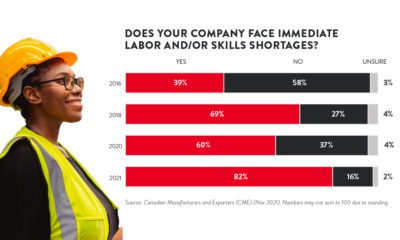
More than four in five manufacturers say they face an immediate skills or labor shortage. What steps can be taken to address the shortages?
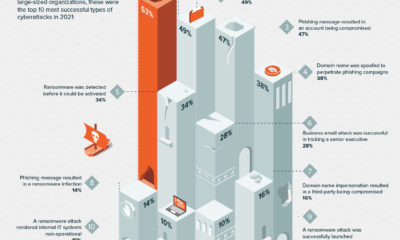
Recent research provides insight into the top cyberattacks that businesses faced in 2021. See the results in this infographic.
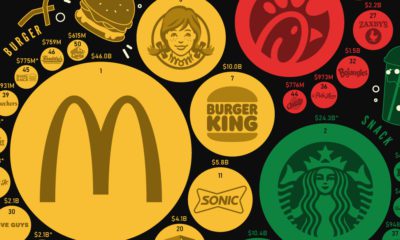
America has hundreds of options for quick and convenient food. But which fast food brands are the most popular, in terms of sales?
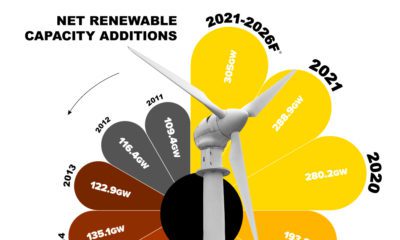
This infographic explores the exponential growth of the technologies that are shaping the new era of energy.
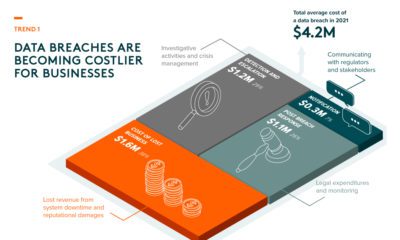
Cyberattacks are becoming more frequent and sophisticated. Here's what investors need to know about the future of cybersecurity.
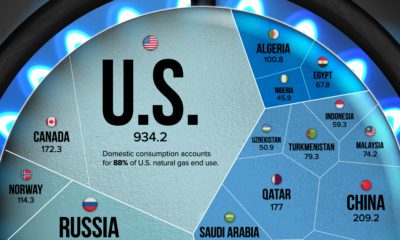
Natural gas prices have risen since Russia's invasion of Ukraine. This visualization highlights the world’s largest natural gas producers.
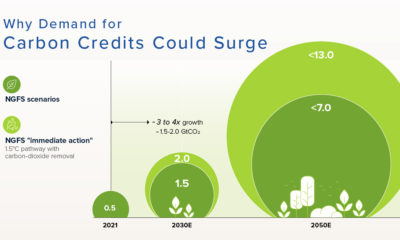
Carbon credits play a vital role in meeting the goals of the Paris Agreement. Here's why demand is set to skyrocket 25-fold by 2050.