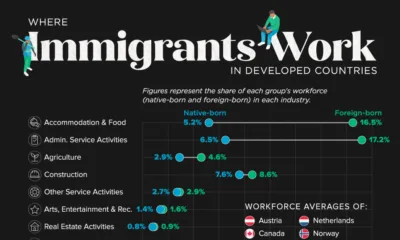
Hospitality and administrative services stand out with the highest immigrant share.


click for more →
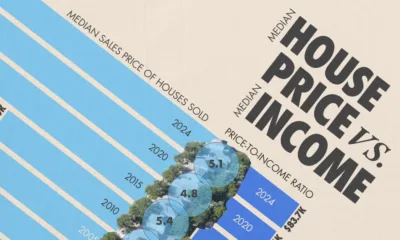

U.S. house prices climbed 415% since 1985 while incomes rose 255%, widening the affordability gap for buyers.
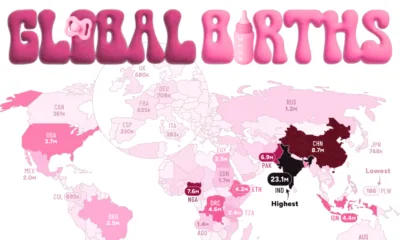

In this graphic, we show the estimated number of births by country, highlighting the dominance of India and China.

See the top 50 global economies ranked by real GDP per capita growth since 2000 to see where economic output per person has grown the most.


Saudi Arabia’s per-capita figure is roughly 12 times higher than that of the U.S.
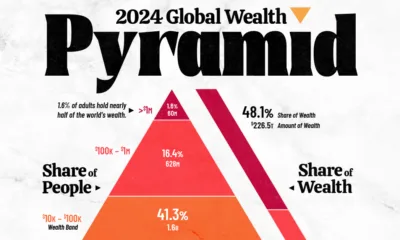

See how global wealth is distributed across 3.8 billion adults, ranging from those with less than $10K in net worth to billionaires.


The average U.S. credit balance is $6,523.


Communication Services led all sectors with a 185% return.


Which global cities are most at risk of a housing bubble? This new map ranks the world’s most overheated real estate markets.
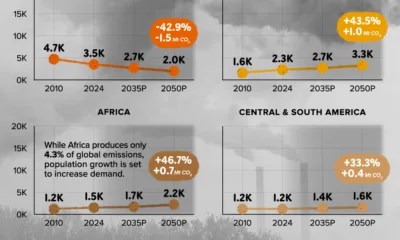

While global carbon emissions are far from climate targets, some regions are forecast to see emission decline meaningfully by 2050.
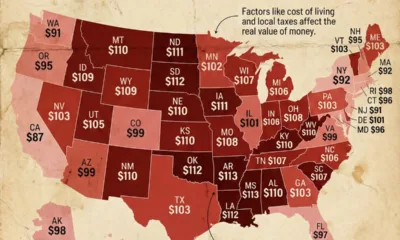

Is a dollar in your pocket worth the same in Albuquerque as it is in New York City? We show the real purchasing power of $100...

click for more →
 Creator Program