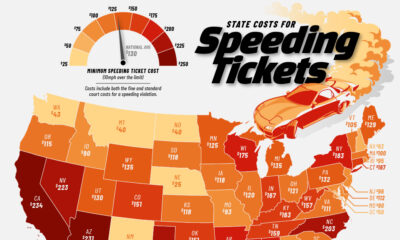
Explore how speeding ticket costs vary by state, from $234 in California to just $25 in New Mexico and Nebraska.


click for more →


This visual timeline of every U.S. recession since 1855, highlights frequency, duration, and trends over time.


Over two billion people still face moderate to severe food insecurity. Explore the global drivers behind hunger, from conflict to climate shocks.
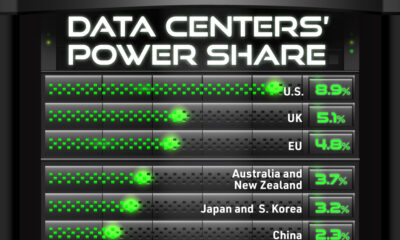

With the rise of AI and cloud services, data center demand is rapidly scaling—and so is its global electricity footprint.
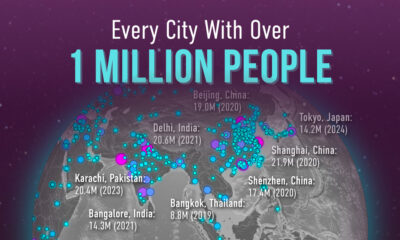

How many cities have over 1 million people? This data-driven map charts every single one, giving you a bird’s-eye view of global urbanization.


Trump’s 2024 financial disclosure shows over $600 million from golf, hotels, crypto token sales, and lucrative brand-licensing deals.


Peace agreements are in sharp decline as a fractured UN Security Council and the internalization of conflict negotiations stall outcomes.


Discover how 150+ minerals and gemstones, from quartz to diamond, fit into distinct chemical groups in this data-rich infographic.
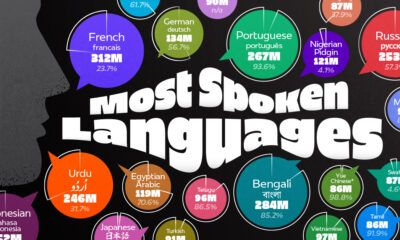

See the most 25 spoken languages in 2025 and the marked difference between English and Mandarin's popularity.
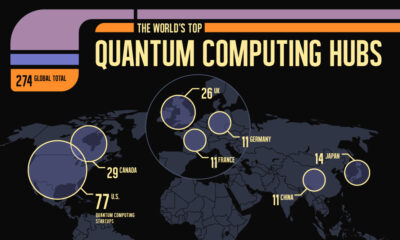

In this graphic, we show the top countries for quantum computing startups as innovation accelerates and global investment ramps up.
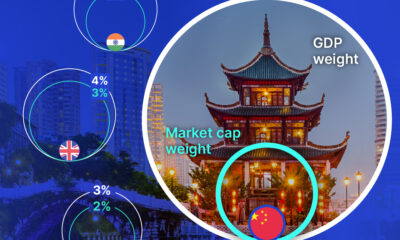

China's economy is a large percentage of global GDP, but the country has a small weight in equity markets—here's what investors need to know.


click for more →


 Creator Program