Energy
Ranked: The Largest Oil and Gas Companies in the World
![]() Subscribe to the Elements free mailing list for more like this
Subscribe to the Elements free mailing list for more like this
The Largest Oil & Gas Companies in 2021
This was originally posted on Elements. Sign up to the free mailing list to get beautiful visualizations on natural resource megatrends in your email every week.
The pandemic brought strong headwinds for the oil and gas industry, and oil majors felt the blow.
Global primary energy consumption fell by 4.5% relative to 2019 and oil demand declined by 9%. For a brief period in April 2020, the price of West Texas Intermediate (WTI) crude futures went subzero, marking the largest one-day price plunge since 1983.
Some expected the demand crash to have a lasting impact on the industry, but it’s safe to say that 2021 has proved otherwise.
Oil Resurfaces as Energy Crisis Deepens
The world is facing a shortage of energy, and peak winter is yet to hit most parts of the globe.
Pandemic-induced supply restraints from producers, in addition to rising energy demand from recovering economies, have sent nations scrambling for petroleum products. Consequently, oil prices are resurfacing to pre-pandemic levels.
As of today, prices of WTI crude futures are at their highest levels in the last five years at over $80 per barrel. Furthermore, U.S. natural gas prices hit a 7-year high of $6.5 per million British thermal units (BTU) earlier this month. Elsewhere, European benchmark natural gas futures have surged 1,300% since May 2020.
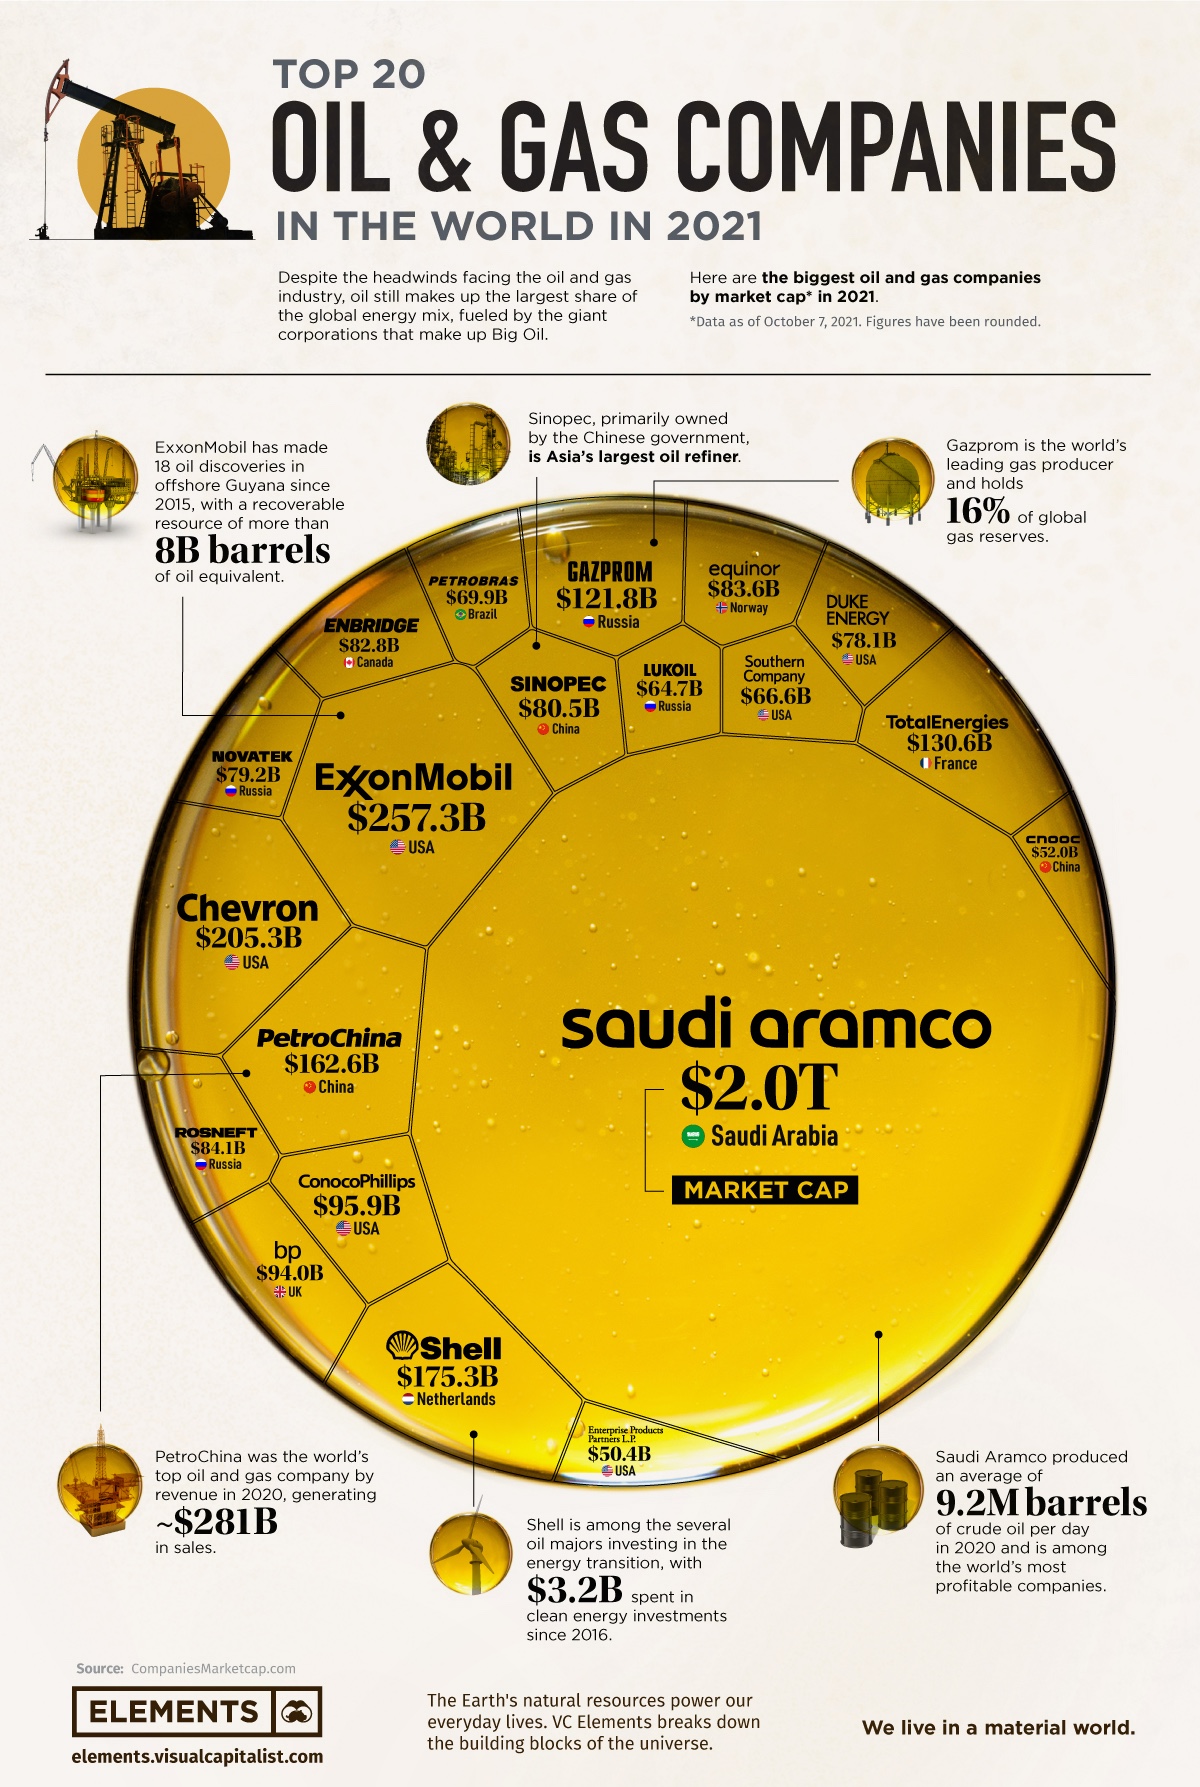
Of course, the largest oil and gas companies are riding this wave of resurgence. Using data from CompaniesMarketCap.com, the above infographic ranks the top 20 oil and gas companies by market cap as of October 7, 2021.
Big Oil: The Largest Oil and Gas Companies by Market Cap
Given that we often see their logos at gas stations, the largest oil and gas companies are generally quite well-known. Here’s how they stack up by market cap:
| Rank | Company | Market Cap* (US$, billions) | Country |
|---|---|---|---|
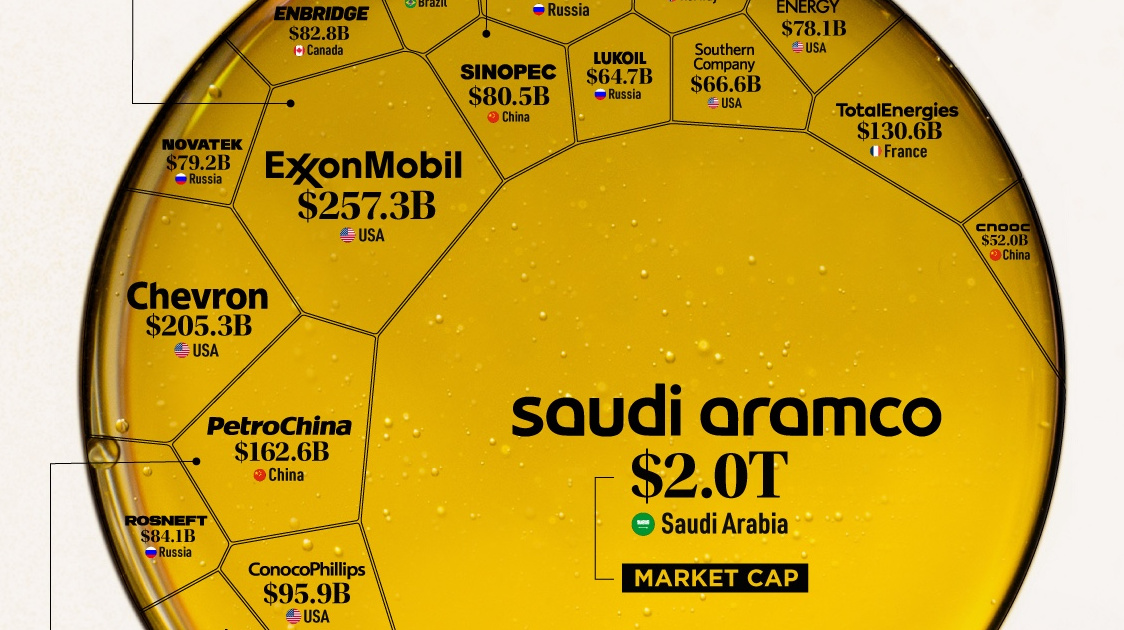
| 1 | Saudi Aramco | $1,979 | Saudi Arabia 🇸🇦 |
| 2 | ExxonMobil | $257.30 | U.S. 🇺🇸 |
| 3 | Chevron | $205.29 | U.S. 🇺🇸 |
| 4 | Shell | $175.28 | Netherlands 🇳🇱 |
| 5 | PetroChina | $162.55 | China 🇨🇳 |
| 6 | TotalEnergies | $130.56 | France 🇫🇷 |
| 7 | Gazprom | $121.77 | Russia 🇷🇺 |
| 8 | ConocoPhillips | $95.93 | U.S. 🇺🇸 |
| 9 | BP | $93.97 | U.K. 🇬🇧 |
| 10 | Rosneft | $84.07 | Russia 🇷🇺 |
| 11 | Equinor | $83.60 | Norway 🇳🇴 |
| 12 | Enbridge | $82.82 | Canada 🇨🇦 |
| 13 | Sinopec | $80.48 | China 🇨🇳 |
| 14 | Novatek | $79.18 | Russia 🇷🇺 |
| 15 | Duke Energy | $78.08 | U.S. 🇺🇸 |
| 16 | Petrobras | $69.91 | Brazil 🇧🇷 |
| 17 | Southern Company | $66.64 | U.S. 🇺🇸 |
| 18 | Lukoil | $64.70 | Russia 🇷🇺 |
| 19 | CNOOC | $52.04 | China 🇨🇳 |
| 20 | Enterprise Products | $50.37 | U.S. 🇺🇸 |
*As of October 7, 2021.
Saudi Aramco is one of the five companies in the trillion-dollar club as the world’s third-largest company by market cap. Its market cap is nearly equivalent to the combined valuation of the other 19 companies on the list. But what makes this figure even more astounding is the fact that the company went public less than two years ago in December 2019.
However, the oil giant’s valuation doesn’t come out of the blue. Aramco was the world’s most profitable company in 2019, raking in $88 billion in net income. Apple took this title in 2020, but high oil prices could propel Aramco back to the top in 2021.
Although Standard Oil was split up a century ago, its legacy lives on today in the form of Big Oil. ExxonMobil and Chevron—the second and third-largest companies on the list—are direct descendants of Standard Oil. Furthermore, Shell and BP both acquired assets from Standard Oil’s original portfolio on the road to becoming global oil giants.
The geographical distribution of the largest oil and gas companies shows how global the industry is. The top 20 oil and gas companies come from 10 different countries. The U.S. hosts six of them, while four are headquartered in Russia. The other 10 are located in one of China, Brazil, Saudi Arabia, or Europe.
Big Oil, Bigger Emissions
Due to the nature of fossil fuels, the biggest oil and gas companies are also among the biggest greenhouse gas (GHG) emitters.
In fact, Saudi Aramco is the world’s largest corporate GHG emitter and accounts for over 4% of the entire world’s emissions since 1965. Chevron, Gazprom, ExxonMobil, BP, and several other oil giants join Aramco on the list of top 20 GHG emitters between 1965 and 2017.
Shifting towards a low-carbon future will undoubtedly require the world to rely less on fossil fuels. But completely shunning the oil and gas industry isn’t possible at the moment, as shown by the global energy crisis.


Energy
Mapped: The Age of Energy Projects in Interconnection Queues, by State
This map shows how many energy projects are in interconnection queues by state and how long these projects have been queued up, on average.


Age of Energy Projects in Interconnection Queues, by State
This was originally posted on our Voronoi app. Download the app for free on iOS or Android and discover incredible data-driven charts from a variety of trusted sources.
By the end of 2023, more than 11,000 energy projects were in interconnection queues in the United States, waiting for a green-light from regional grid operators to proceed with construction.
This map, created in partnership with the National Public Utilities Council, maps out the average age of active energy projects in interconnection queues by state, using data from Berkeley Lab.
Interconnection Queues, Explained
Interconnection queues are lists of energy projects that have made interconnection requests to their regional grid operators. Once submitted, these requests formally initiate the impact study process that each project goes through before grid connection, forming waiting lists for approval known as interconnection queues.
In recent years, both the number and generation capacity of queued projects have surged in the United States, along with the length of time spent in queue.
According to Berkeley Lab, the amount of generation capacity entering queues each year has risen by more than 550% from 2015 to 2023, with average queue duration rising from 3 years to 5 years the same period.
As a result of the growing backlog, a large proportion of projects ultimately withdraw from queues, leading to only 19% of applications reaching commercial operations.
The Backlog: Number of Projects and Average Wait Times
Of the 11,000 active projects in U.S. queues at the end of 2023, Texas, California, and Virginia had the most in queue; 1,208, 947, and 743, respectively.
When looking at the average ages of these projects, all three states hovered around the national average of 34 months (2.83 years), with Texas sporting 28 months, California 33, and Virginia 34.
Vermont, Minnesota, Wisconsin, and Florida, on the other hand, had the highest average queue durations; 54, 49, 47, and 46 months, respectively.
Average Queue Duration by Project Type
At the end of 2023, more than 95% of the generation capacity in active interconnection queues was for emission-free resources. The table below provides a breakdown.
| Project Type | Average Queue Duration (As of 12/31/2023) | Number of Projects in Queue |
|---|---|---|
| Wind | 40 months | 841 |
| Solar | 34 months | 4,506 |
| Wind+Battery | 34 months | 76 |
| Solar+Battery | 27 months | 2,377 |
| Battery | 24 months | 2,818 |
Wind projects had the highest wait times at the end of 2023 with an average age of 40 months (3.33 years). Solar projects, on the other hand, made up more than 40% of projects in queue.
Overall, reducing the time that these renewable energy projects spend in queues can accelerate the transition to a low-carbon energy future.
According to the U.S. Department of Energy, enhancing data transparency, streamlining approval processes, promoting economic efficiency, and maintaining a reliable grid are some of the ways this growing backlog can be mitigated.

-

 Wealth6 days ago
Charted: Which City Has the Most Billionaires in 2024?
-

 Mining2 weeks ago
Gold vs. S&P 500: Which Has Grown More Over Five Years?
-

 Uranium2 weeks ago
The World’s Biggest Nuclear Energy Producers
-

 Education2 weeks ago
How Hard Is It to Get Into an Ivy League School?
-

 Debt2 weeks ago
How Debt-to-GDP Ratios Have Changed Since 2000
-

 Sports2 weeks ago
The Highest Earning Athletes in Seven Professional Sports
-

 Science2 weeks ago
Visualizing the Average Lifespans of Mammals
-

 Brands1 week ago
How Tech Logos Have Evolved Over Time