Business
Ranked: The World’s Largest Container Shipping Companies


Visualizing the World’s Largest Container Shipping Companies
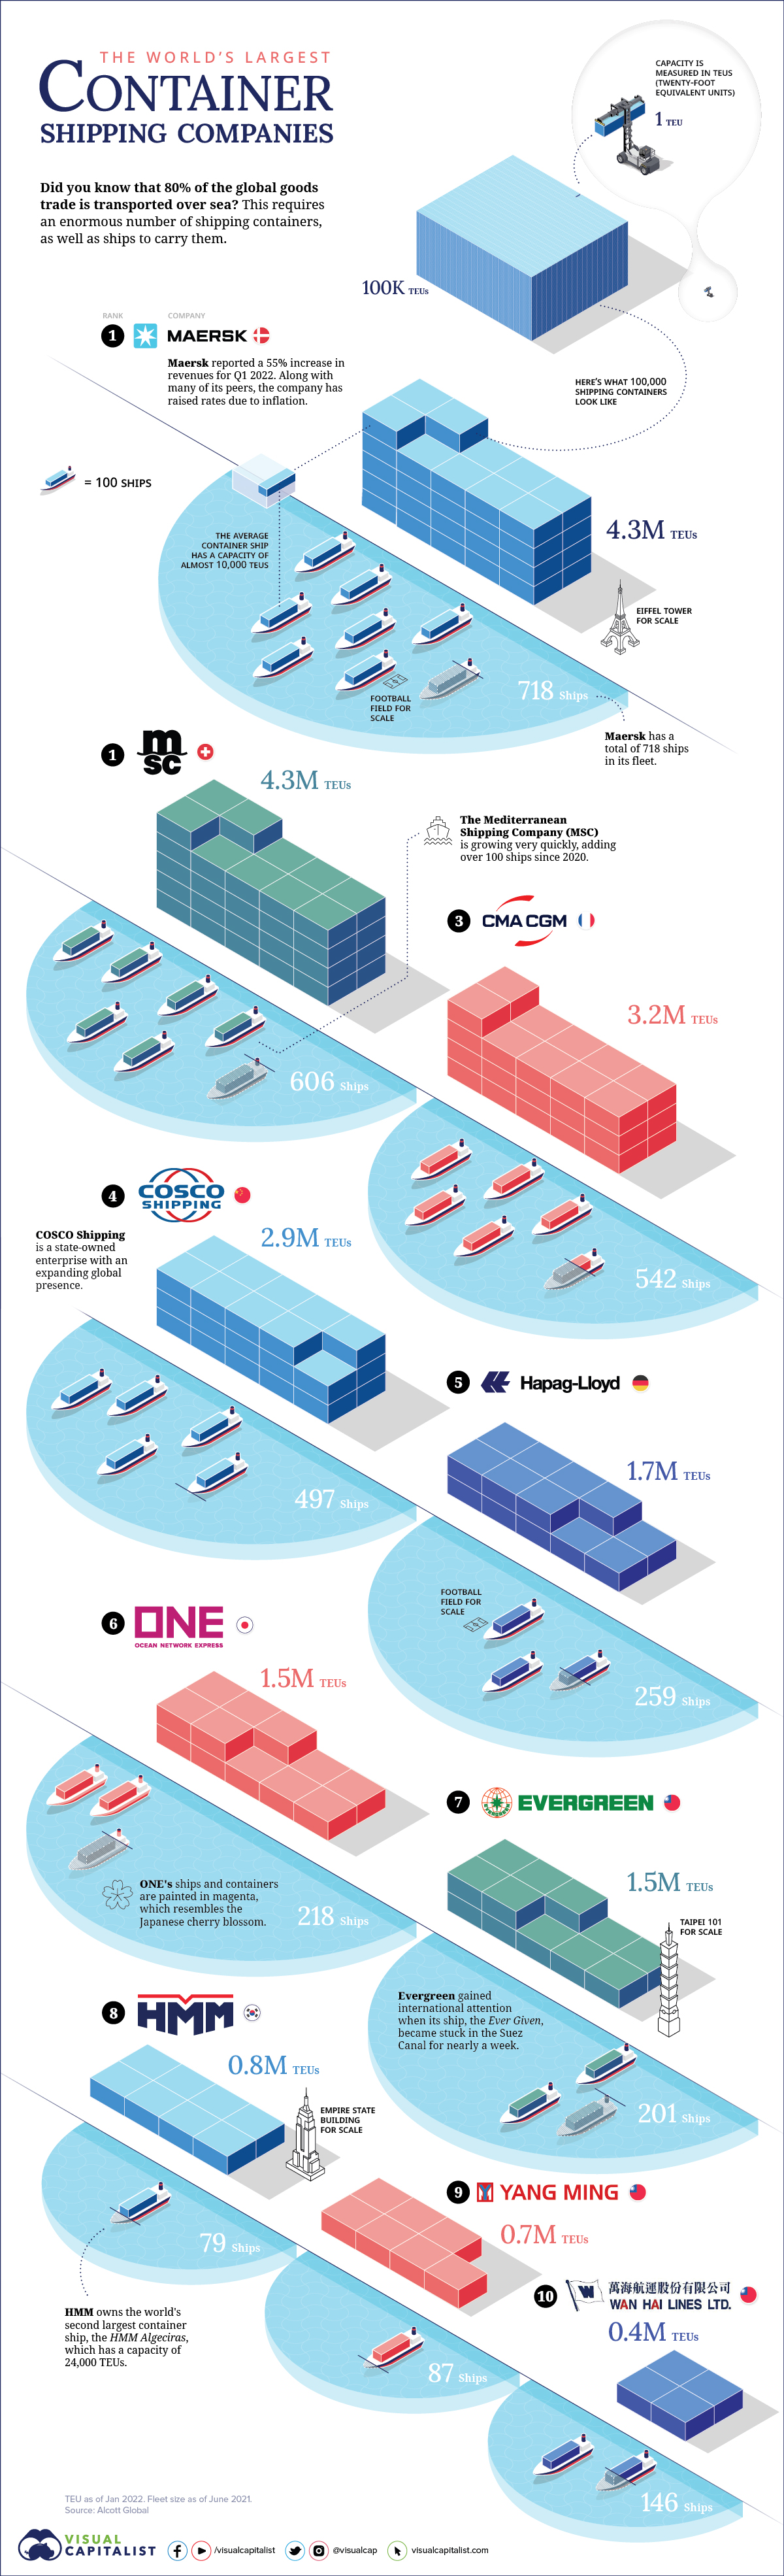
Did you know that 80% of the global goods trade is transported over sea? Given the scale of human consumption, this requires an enormous number of shipping containers, as well as ships to carry them.
At an industry level, container shipping is dominated by several very large firms. This includes Maersk, COSCO Shipping, and Evergreen. If you live along the coast, you’ve probably seen ships or containers with these names painted on them.
Generally speaking, however, consumers know very little about these businesses. This graphic aims to change that by ranking the 10 largest container shipping companies in the world.
Ranking the Top 10
Companies are ranked by two metrics. First is the number of ships they own, and second is their total shipping capacity measured in twenty-foot equivalent units (TEUs). A TEU is based on the volume of a twenty-foot long shipping container.
The data used in this infographic comes from Alcott Global, a logistics consultancy. Fleet sizes are as of June 2021, while TEU capacity is from January 2022.
| Rank | Company | Country | TEU | # of Ships |
|---|---|---|---|---|
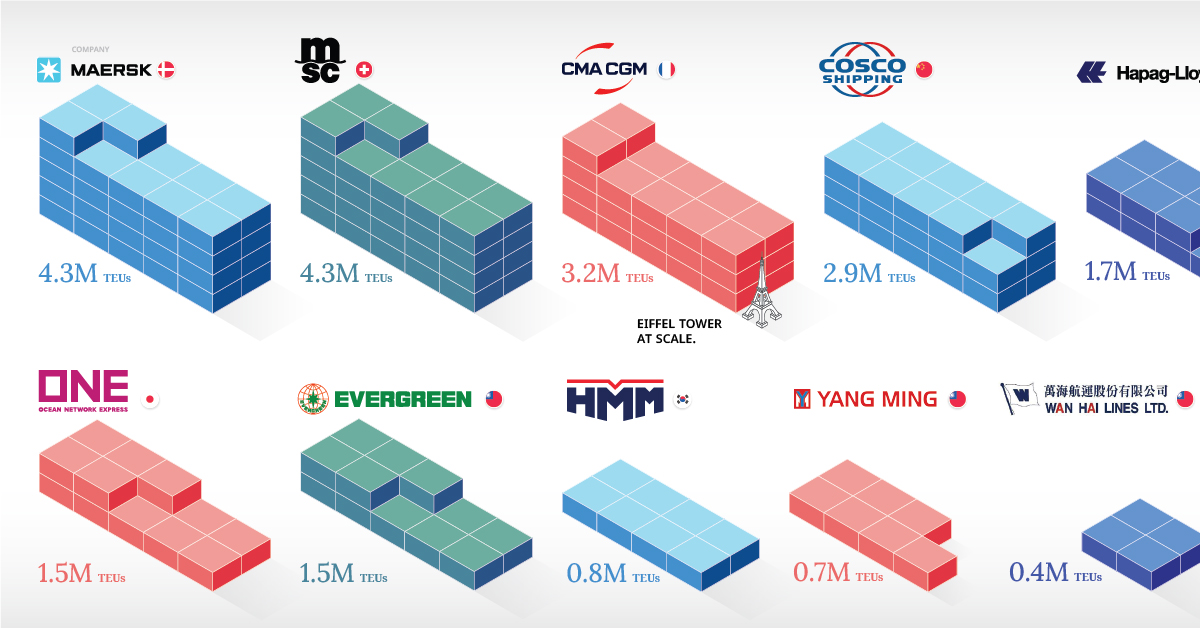
| 1 | Maersk | 🇩🇰 Denmark | 4.3M | 718 |
| 1 | MSC | 🇨🇭 Switz. | 4.3M | 606 |
| 3 | CMA CGM | 🇫🇷 France | 3.2M | 542 |
| 4 | COSCO Shipping | 🇨🇳 China | 2.9M | 497 |
| 5 | Hapag-Lloyd | 🇩🇪 Germany | 1.7M | 259 |
| 6 | Ocean Network Express | 🇯🇵 Japan | 1.5M | 218 |
| 7 | Evergreen Marine | 🇹🇼 Taiwan | 1.5M | 201 |
| 8 | HMM | 🇰🇷 S. Korea | 0.8M | 79 |
| 9 | Yang Ming | 🇹🇼 Taiwan | 0.7M | 87 |
| 10 | Wan Hai Lines | 🇹🇼 Taiwan | 0.4M | 146 |
In this dataset, Maersk and MSC are tied for first place in terms of TEU capacity. This is no longer the case, as news outlets have recently reported that MSC has overtaken the former.
Trailing behind the two industry leaders is a mixture of European and Asian firms. Many of these companies have grown through mergers and acquisitions.
Interesting Facts
Maersk
At the time of writing, Maersk is Denmark’s third largest company by market capitalization. The firm was founded in 1904, making it 118 years old.
MSC
The Mediterranean Shipping Company (MSC) has grown very quickly in recent years, catching up to (and surpassing) long-time leader Maersk in terms of TEU capacity.
The Swiss firm has increased its fleet size through new orders, acquisition of second-hand vessels, and charter deals.
COSCO Shipping
COSCO Shipping is China’s state-owned shipping company. American officials have raised concerns about the firm’s expanding global influence.
For context, Chinese state-owned enterprises have ownership stakes in terminals at five U.S. ports. This includes Terminal 30 at the Port of Seattle, in which two COSCO subsidiaries hold a 33.33% stake.
Moving forward, any further Chinese interest in U.S. terminals will face an even more stringent regulatory environment.
– Kardon (2021)
Evergreen
Evergreen is likely a familiar name, but not for the right reasons. In 2021, one of the company’s ships, Ever Given, became stuck in the Suez Canal, putting one of the world’s most important shipping routes out of commission for nearly a week.
Bulking Up
To achieve better economies of scale, container ships are growing bigger and bigger. The following chart illustrates this trend from 1970 to 2017.
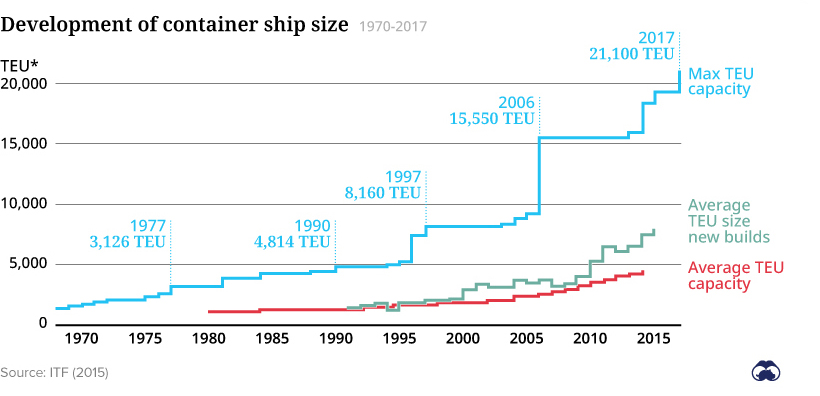
Average capacity is being pulled upwards by the arrival of mega-ships, which are ships that have a capacity of over 18,000 TEUs. Their massive size creates problems for ports that weren’t designed to handle such a high volume of traffic.
It’s worth noting that the largest ship today, the Ever Ace (owned by Evergreen), has a capacity of 24,000 TEUs. Watch this YouTube video for some impressive footage of the ship.
Going Green
Bloomberg reports that shipping accounts for 3% of the world’s carbon emissions. If the industry were a country, that would make it the world’s sixth-largest emitter.
Due to the growth of ESG investing, shipping companies have faced pressure to decarbonize their ships. Progress to this day has been limited, but there are many solutions in the pipeline.
One option is alternative fuels, such as liquefied natural gas (LNG), hydrogen, or biofuels made from plants. These fuels could enable ships to greatly decrease their emissions.
Another option is to completely do away with fuel, and instead return to the centuries-old technology of wind power.


Markets
Ranked: The Largest U.S. Corporations by Number of Employees
We visualized the top U.S. companies by employees, revealing the massive scale of retailers like Walmart, Target, and Home Depot.


The Largest U.S. Corporations by Number of Employees
This was originally posted on our Voronoi app. Download the app for free on Apple or Android and discover incredible data-driven charts from a variety of trusted sources.
Revenue and profit are common measures for measuring the size of a business, but what about employee headcount?
To see how big companies have become from a human perspective, we’ve visualized the top U.S. companies by employees. These figures come from companiesmarketcap.com, and were accessed in March 2024. Note that this ranking includes publicly-traded companies only.
Data and Highlights
The data we used to create this list of largest U.S. corporations by number of employees can be found in the table below.
| Company | Sector | Number of Employees |
|---|---|---|
| Walmart | Consumer Staples | 2,100,000 |
| Amazon | Consumer Discretionary | 1,500,000 |
| UPS | Industrials | 500,000 |
| Home Depot | Consumer Discretionary | 470,000 |
| Concentrix | Information Technology | 440,000 |
| Target | Consumer Staples | 440,000 |
| Kroger | Consumer Staples | 430,000 |
| UnitedHealth | Health Care | 400,000 |
| Berkshire Hathaway | Financials | 383,000 |
| Starbucks | Consumer Discretionary | 381,000 |
| Marriott International | Consumer Discretionary | 377,000 |
| Cognizant | Information Technology | 346,600 |
Retail and Logistics Top the List
Companies like Walmart, Target, and Kroger have a massive headcount due to having many locations spread across the country, which require everything from cashiers to IT professionals.
Moving goods around the world is also highly labor intensive, explaining why UPS has half a million employees globally.
Below the Radar?
Two companies that rank among the largest U.S. corporations by employees which may be less familiar to the public include Concentrix and Cognizant. Both of these companies are B2B brands, meaning they primarily work with other companies rather than consumers. This contrasts with brands like Amazon or Home Depot, which are much more visible among average consumers.
A Note on Berkshire Hathaway
Warren Buffett’s company doesn’t directly employ 383,000 people. This headcount actually includes the employees of the firm’s many subsidiaries, such as GEICO (insurance), Dairy Queen (retail), and Duracell (batteries).
If you’re curious to see how Buffett’s empire has grown over the years, check out this animated graphic that visualizes the growth of Berkshire Hathaway’s portfolio from 1994 to 2022.

-

 Technology2 weeks ago
Ranked: The Most Popular Smartphone Brands in the U.S.
-

 Automotive1 week ago
Almost Every EV Stock is Down After Q1 2024
-

 Money1 week ago
Where Does One U.S. Tax Dollar Go?
-

 Green2 weeks ago
Ranked: Top Countries by Total Forest Loss Since 2001
-

 Real Estate2 weeks ago
Visualizing America’s Shortage of Affordable Homes
-

 Maps2 weeks ago
Mapped: Average Wages Across Europe
-

 Mining2 weeks ago
Charted: The Value Gap Between the Gold Price and Gold Miners
-

 Demographics2 weeks ago
Visualizing the Size of the Global Senior Population