Sponsored
Mapped: The World’s Fastest Growing eCommerce Markets
The following content is sponsored by Logiq
The World’s Fastest Growing eCommerce Markets
While the overall retail industry struggled amidst the global pandemic, eCommerce sales managed to reach unprecedented heights. In 2020, retail eCommerce sales grew by 27.6%, reaching a total of $4.28 trillion worldwide.
But which regions saw the biggest increases throughout 2020, and how does each market compare to one another? This graphic, presented by Logiq, explores the fastest growing eCommerce markets across the globe.
Which Markets Saw the Most Growth?
In 2020, Latin America’s eCommerce market saw the most growth of any region, surpassing Asia-Pacific’s growth for the first time since 2010.
Rank | Region | Sales Growth YoY (2020) |
---|---|---|
1 | Latin America | 36.7% |
2 | North America | 31.8% |
3 | Central & Eastern Europe | 29.1% |
4 | Asia-Pacific | 26.4% |
5 | Western Europe | 26.3% |
6 | Middle East & Africa | 19.8% |
Worldwide Average | 27.6% |
The pandemic played a big role in Latin America’s growth. The region’s two major economic hubs Buenos Aires, Argentina and São Paulo, Brazil had to endure strict pandemic-induced lockdowns, which ultimately led to significant growth of the eCommerce market.
Restrictions in Buenos Aires were on and off from late March until early November 2020, and after restrictions were lifted, citizens were encouraged to practice “intelligent” social distancing and be more cautious when socializing.
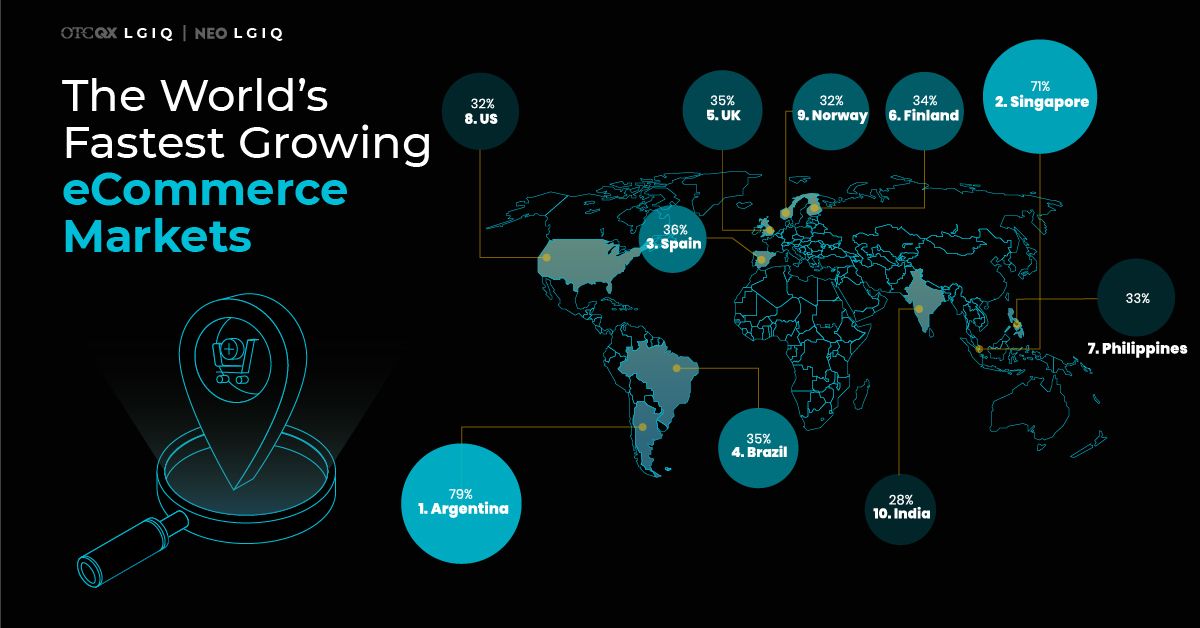
At the country level, Argentina was the fastest growing eCommerce market in 2020, with a 79% increase in online sales compared to 2019—almost double the worldwide country average.
Rank | Country | Sales Growth YoY (2020) |
---|---|---|
1 | 🇦🇷 Argentina | 79.0% |
2 | 🇸🇬 Singapore | 71.1% |
3 | 🇪🇸 Spain | 36.0% |
4 | 🇧🇷 Brazil | 35.0% |
5 | 🇬🇧 UK | 34.7% |
6 | 🇫🇮 Finland | 33.5% |
7 | 🇵🇭 Philippines | 33.0% |
8 | 🇺🇸 US | 32.4% |
9 | 🇳🇴 Norway | 32.2% |
10 | 🇮🇳 India | 27.6% |
Worldwide Average | 41.5% |
Singapore was the second-fastest, with a 71.1% increase in eCommerce sales.
Keen to capitalize on this rising trend, Singapore has rolled out a number of policies and initiatives in an effort to support its digital industry.
For example, under the Skills Ignition SG initiative, several Singaporean government agencies have partnered with Google to provide training for aspiring tech workers.
Third on the ranking is Spain with a 36% increase in eCommerce sales. Spain was severely impacted by COVID-19—in the early days of the pandemic, cases in Spain rose quickly, causing strain on the country’s healthcare system and ultimately driving the country into strict lockdown, which forced consumers to turn to online shopping.
eCommerce Growth, by Category
Though eCommerce sales in 2020 saw an overall increase, some industries saw more success than others. For instance, global spending on Food and Personal Care grew significantly (44.8%) in 2020, while Travel spending dipped more than 50%.
Category | % Global change in spending (2019-2020) |
---|---|
Food & Personal Care | 44.8% |
Electronics & Physical Media | 43.9% |
Toys, DIY & Hobbies | 37.4% |
Digital Music | 35.2% |
Fashion & Beauty | 34.4% |
Video Games | 32.8% |
Furniture & Appliances | 30.9% |
Travel, Mobility & Accommodation | -52.6% |
Of course, since travel is expected to bounce back by 2023, according to a recent report by the International Air Transport Association, these figures are likely to change in the near future.
Different Markets, Different Marketing
While eCommerce has grown worldwide, each individual market looks slightly different, which means generic marketing tactics won’t work across the board.
That’s why companies need eCommerce support that caters to their unique needs if they’re hoping to level up their eCommerce game. Logiq is a holistic eCommerce platform that provides versatile services, which can help companies worldwide.
In this rapidly growing space, Logiq helps businesses better understand their audience, gather insight into the techniques that best serve them and ultimately gain their rightful piece of the pie.
Sponsored
Ranked: Emissions per Capita of the Top 30 U.S. Investor-Owned Utilities
Roughly 25% of all GHG emissions come from electricity production. See how the top 30 IOUs rank by emissions per capita.

Emissions per Capita of the Top 30 U.S. Investor-Owned Utilities
Approximately 25% of all U.S. greenhouse gas emissions (GHG) come from electricity generation.
Subsequently, this means investor-owned utilities (IOUs) will have a crucial role to play around carbon reduction initiatives. This is particularly true for the top 30 IOUs, where almost 75% of utility customers get their electricity from.
This infographic from the National Public Utilities Council ranks the largest IOUs by emissions per capita. By accounting for the varying customer bases they serve, we get a more accurate look at their green energy practices. Here’s how they line up.
Per Capita Rankings
The emissions per capita rankings for the top 30 investor-owned utilities have large disparities from one another.
Totals range from a high of 25.8 tons of CO2 per customer annually to a low of 0.5 tons.
Utility | Emissions Per Capita (CO2 tons per year) | Total Emissions (M) |
---|---|---|
TransAlta | 25.8 | 16.3 |
Vistra | 22.4 | 97.0 |
OGE Energy | 21.5 | 18.2 |
AES Corporation | 19.8 | 49.9 |
Southern Company | 18.0 | 77.8 |
Evergy | 14.6 | 23.6 |
Alliant Energy | 14.4 | 14.1 |
DTE Energy | 14.2 | 29.0 |
Berkshire Hathaway Energy | 14.0 | 57.2 |
Entergy | 13.8 | 40.5 |
WEC Energy | 13.5 | 22.2 |
Ameren | 12.8 | 31.6 |
Duke Energy | 12.0 | 96.6 |
Xcel Energy | 11.9 | 43.3 |
Dominion Energy | 11.0 | 37.8 |
Emera | 11.0 | 16.6 |
PNM Resources | 10.5 | 5.6 |
PPL Corporation | 10.4 | 28.7 |
American Electric Power | 9.2 | 50.9 |
Consumers Energy | 8.7 | 16.1 |
NRG Energy | 8.2 | 29.8 |
Florida Power and Light | 8.0 | 41.0 |
Portland General Electric | 7.6 | 6.9 |
Fortis Inc. | 6.1 | 12.6 |
Avangrid | 5.1 | 11.6 |
PSEG | 3.9 | 9.0 |
Exelon | 3.8 | 34.0 |
Consolidated Edison | 1.6 | 6.3 |
Pacific Gas and Electric | 0.5 | 2.6 |
Next Era Energy Resources | 0 | 1.1 |
PNM Resources data is from 2019, all other data is as of 2020
Let’s start by looking at the higher scoring IOUs.
TransAlta
TransAlta emits 25.8 tons of CO2 emissions per customer, the largest of any utility on a per capita basis. Altogether, the company’s 630,000 customers emit 16.3 million metric tons. On a recent earnings call, its management discussed clear intent to phase out coal and grow their renewables mix by doubling their renewables fleet. And so far it appears they’ve been making good on their promise, having shut down the Canadian Highvale coal mine recently.
Vistra
Vistra had the highest total emissions at 97 million tons of CO2 per year and is almost exclusively a coal and gas generator. However, the company announced plans for 60% reductions in CO2 emissions by 2030 and is striving to be carbon neutral by 2050. As the highest total emitter, this transition would make a noticeable impact on total utility emissions if successful.
Currently, based on their 4.3 million customers, Vistra sees per capita emissions of 22.4 tons a year. The utility is a key electricity provider for Texas, ad here’s how their electricity mix compares to that of the state as a whole:
Energy Source | Vistra | State of Texas |
---|---|---|
Gas | 63% | 52% |
Coal | 29% | 15% |
Nuclear | 6% | 9% |
Renewables | 1% | 24% |
Oil | 1% | 0% |
Despite their ambitious green energy pledges, for now only 1% of Vistra’s electricity comes from renewables compared to 24% for Texas, where wind energy is prospering.
Based on those scores, the average customer from some of the highest emitting utility groups emit about the same as a customer from each of the bottom seven, who clearly have greener energy practices. Let’s take a closer look at emissions for some of the bottom scoring entities.
Utilities With The Greenest Energy Practices
Groups with the lowest carbon emission scores are in many ways leaders on the path towards a greener future.
Exelon
Exelon emits only 3.8 tons of CO2 emissions per capita annually and is one of the top clean power generators across the Americas. In the last decade they’ve reduced their GHG emissions by 18 million metric tons, and have recently teamed up with the state of Illinois through the Clean Energy Jobs Act. Through this, Exelon will receive $700 million in subsidies as it phases out coal and gas plants to meet 2030 and 2045 targets.
Consolidated Edison
Consolidated Edison serves nearly 4 million customers with a large chunk coming from New York state. Altogether, they emit 1.6 tons of CO2 emissions per capita from their electricity generation.
The utility group is making notable strides towards a sustainable future by expanding its renewable projects and testing higher capacity limits. In addition, they are often praised for their financial management and carry the title of dividend aristocrat, having increased their dividend for 47 years and counting. In fact, this is the longest out of any utility company in the S&P 500.
A Sustainable Tomorrow
Altogether, utilities will have a pivotal role to play in decarbonization efforts. This is particularly true for the top 30 U.S. IOUs, who serve millions of Americans.
Ultimately, this means a unique moment for utilities is emerging. As the transition toward cleaner energy continues and various groups push to achieve their goals, all eyes will be on utilities to deliver.
The National Public Utilities Council is the go-to resource to learn how utilities can lead in the path towards decarbonization.
Sponsored
The Road to Decarbonization: How Asphalt is Affecting the Planet
The U.S. alone generates ∼12 million tons of asphalt shingles tear-off waste and installation scrap every year and more than 90% of it is dumped into landfills.

The Road to Decarbonization: How Asphalt is Affecting the Planet
Asphalt, also known as bitumen, has various applications in the modern economy, with annual demand reaching 110 million tons globally.
Until the 20th century, natural asphalt made from decomposed plants accounted for the majority of asphalt production. Today, most asphalt is refined from crude oil.
This graphic, sponsored by Northstar Clean Technologies, shows how new technologies to reuse and recycle asphalt can help protect the environment.
The Impact of Climate Change
Pollution from vehicles is expected to decline as electric vehicles replace internal combustion engines.
But pollution from asphalt could actually increase in the next decades because of rising temperatures in some parts of the Earth. When subjected to extreme temperatures, asphalt releases harmful greenhouse gases (GHG) into the atmosphere.
Emissions from Road Construction (Source) | CO2 equivalent (%) |
---|---|
Asphalt | 28% |
Concrete | 18% |
Excavators and Haulers | 16% |
Trucks | 13% |
Crushing Plant | 10% |
Galvanized Steel | 6% |
Reinforced Steel | 6% |
Plastic Piping | 2% |
Geotextile | 1% |
Asphalt paved surfaces and roofs make up approximately 45% and 20% of surfaces in U.S. cities, respectively. Furthermore, 75% of single-family detached homes in Canada and the U.S. have asphalt shingles on their roofs.
Reducing the Environmental Impact of Asphalt
Similar to roads, asphalt shingles have oil as the primary component, which is especially harmful to the environment.
Shingles do not decompose or biodegrade. The U.S. alone generates ∼12 million tons of asphalt shingles tear-off waste and installation scrap every year and more than 90% of it is dumped into landfills, the equivalent of 20 million barrels of oil.
But most of it can be reused, rather than taking up valuable landfill space.
Using technology, the primary components in shingles can be repurposed into liquid asphalt, aggregate, and fiber, for use in road construction, embankments, and new shingles.
Providing the construction industry with clean, sustainable processing solutions is also a big business opportunity. Canada alone is a $1.3 billion market for recovering and reprocessing shingles.
Northstar Clean Technologies is the only public company that repurposes 99% of asphalt shingles components that otherwise go to landfills.
-
Misc1 week ago
The Top 10 Largest Nuclear Explosions, Visualized
-
Technology4 weeks ago
How Do Big Tech Giants Make Their Billions?
-
Energy2 weeks ago
Mapped: Solar and Wind Power by Country
-
Datastream4 weeks ago
Visualizing Companies with the Most Patents Granted in 2021
-
Politics2 weeks ago
Mapped: The State of Global Democracy in 2022
-
Technology2 weeks ago
Synthetic Biology: The $3.6 Trillion Science Changing Life as We Know It
-
Markets3 weeks ago
Why Investors Tuned Out Netflix
-
Markets3 weeks ago
Charted: U.S. Consumer Debt Approaches $16 Trillion