Markets
Visualizing the World’s Busiest Ports
The World’s Busiest Ports
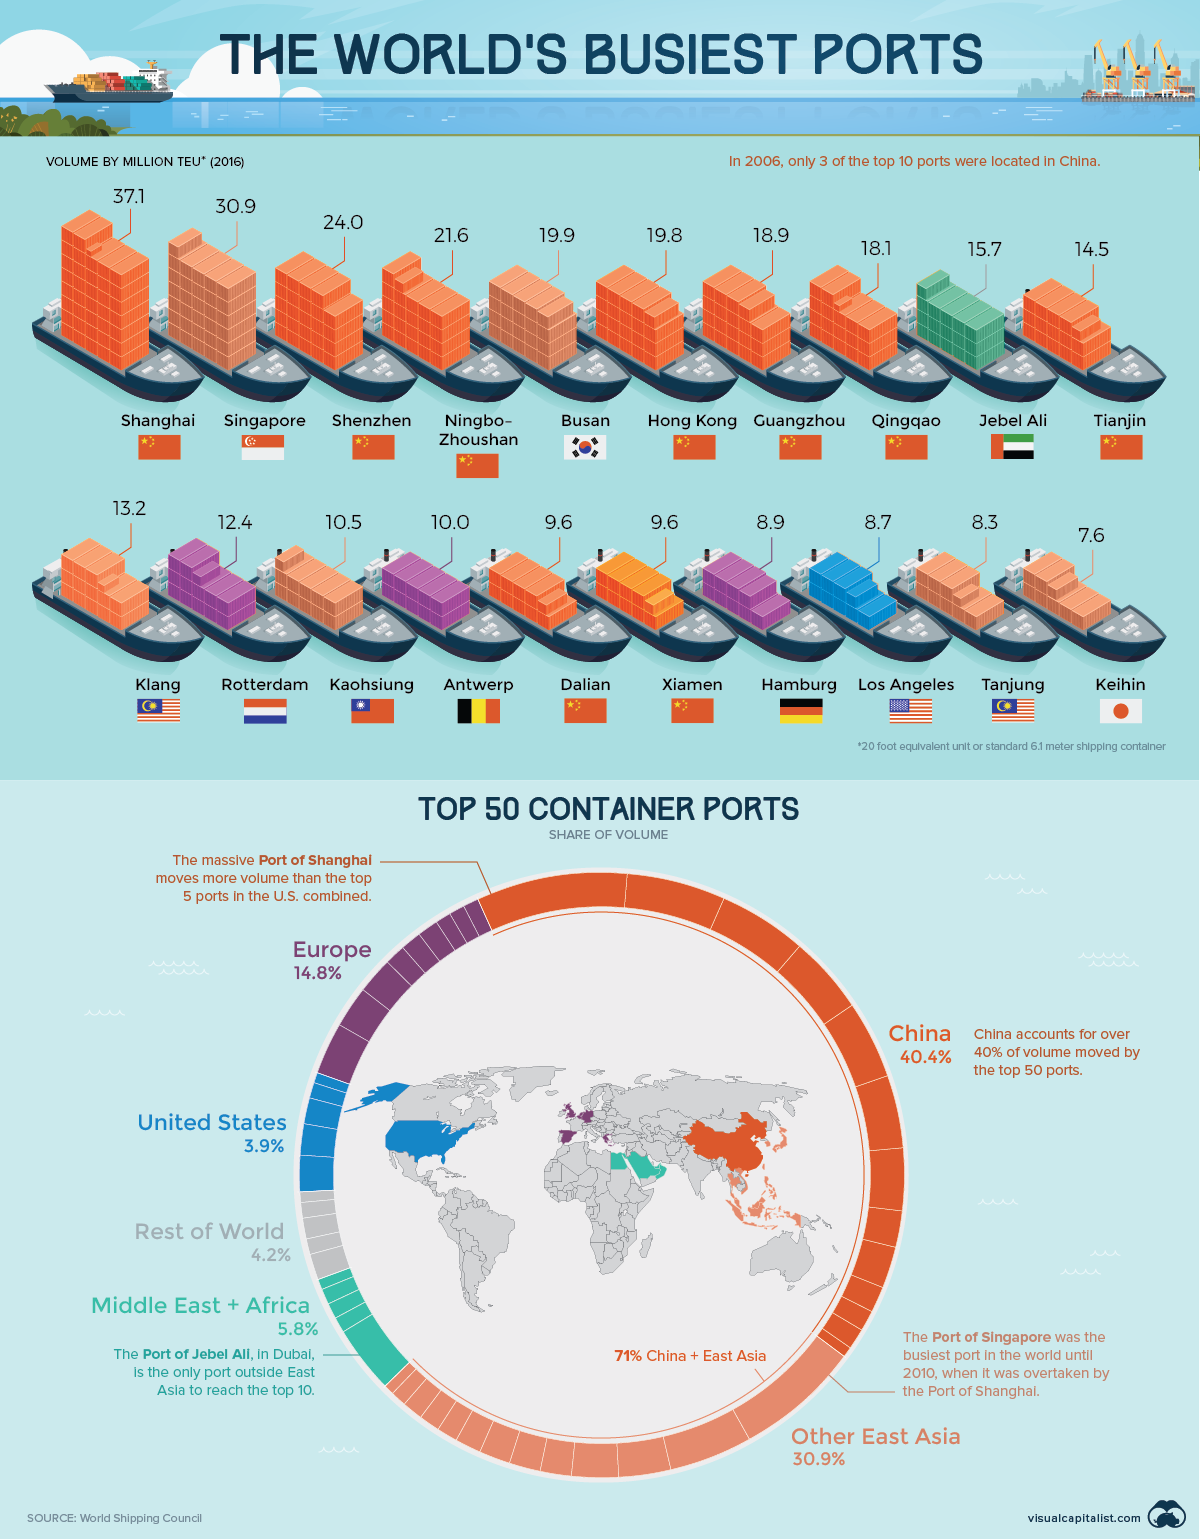
An estimated 90% of world trade is facilitated by maritime shipping, and as trade volumes continue to increase, the world’s busiest ports continue to grow larger and more efficient to meet demand.
In fact, in just the last four years, the median annual volume of the top 50 ports jumped from 5.49 to 5.86 million twenty-foot equivalent units (TEUs).
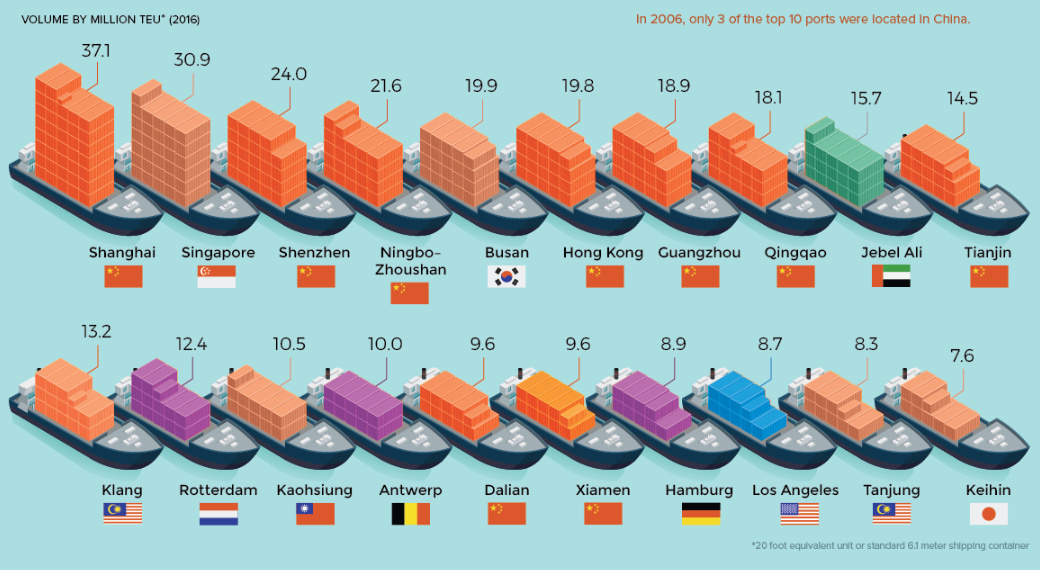
Here are the world’s 20 largest ports, using the most recent data from the World Shipping Council:
| Rank | Port Name | Country | 2016 Volume | 2012 Volume | 4-Year Change |
|---|---|---|---|---|---|
| 1 | Shanghai | 🇨🇳 China | 37.1 | 32.5 | +14% |
| 2 | Singapore | 🇸🇬 Singapore | 30.9 | 31.7 | -2% |
| 3 | Shenzhen | 🇨🇳 China | 24.0 | 22.9 | +5% |
| 4 | Ningbo-Zhoushan | 🇨🇳 China | 21.6 | 16.8 | +28% |
| 5 | Busan | 🇰🇷 S. Korea | 19.9 | 17.0 | +17% |
| 6 | Hong Kong | 🇭🇰 China | 19.8 | 23.1 | -14% |
| 7 | Guangzhou Harbor | 🇨🇳 China | 18.9 | 14.7 | +28% |
| 8 | Qingdao | 🇨🇳 China | 18.0 | 14.5 | +24% |
| 9 | Jebel Ali | 🇦🇪 U.A.E. | 15.7 | 13.3 | +18% |
| 10 | Tianjin | 🇨🇳 China | 14.5 | 12.3 | +18% |
| 11 | Port Klang | 🇲🇾 Malaysia | 13.2 | 10.0 | +32% |
| 12 | Rotterdam | 🇳🇱 Netherlands | 12.4 | 11.9 | +4% |
| 13 | Kaohsiung | 🇹🇼 Taiwan | 10.5 | 9.8 | +7% |
| 14 | Antwerp | 🇧🇪 Belgium | 10.0 | 8.6 | +16% |
| 15 | Dalian | 🇨🇳 China | 9.6 | 8.9 | +8% |
| 16 | Xiamen | 🇨🇳 China | 9.6 | 7.2 | +34% |
| 17 | Hamburg | 🇩🇪 Germany | 8.91 | 8.89 | 0% |
| 18 | Los Angeles | 🇺🇸 U.S.A. | 8.9 | 8.1 | +10% |
| 19 | Tanjung Pelepas | 🇲🇾 Malaysia | 8.3 | 7.7 | +8% |
| 20 | Keihin | 🇯🇵 Japan | 7.6 | 7.9 | -3% |
Volume is measured in millions of TEUs
Only five of the top 20 ports in the world are now located outside of East Asia. The Port of Los Angeles is the only U.S. entrant in the top 20, and only three European ports made the cut.
Today, trade is more likely than ever to flow through the South China Sea.
Ruling the High Seas
From dollar store knick-knacks to nuclear reactor components, China’s manufacturing output is a critical link in the global supply chain. Getting all those products to consumers and companies around the world is big business, and over the past decade, China has emerged as the heavyweight champion of world shipping.
While Danish company, Maersk, is still the largest shipping line, an ever increasing share of the world’s container traffic is moving through Chinese controlled ports. An estimated two-thirds of container traffic now passes through Chinese ports or ports that have received Chinese investment.
New Kids on the Block
While shipping volumes on a global basis continue to rise, not all of that growth has been spread around equally. This is particularly true for established titans of the South China Sea.
At the outset of this millennium, Hong Kong and Singapore were home to the busiest ports in the world. Today, both are facing increased competition from neighboring ports, as well as declining volumes:
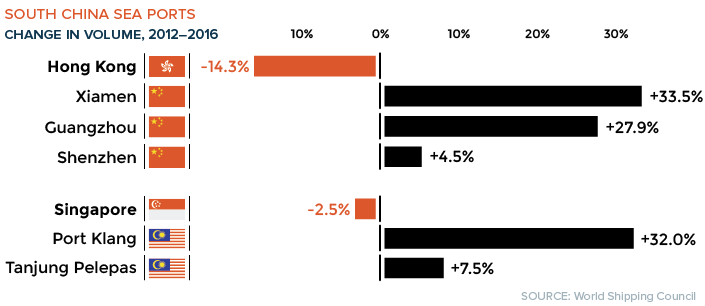
In contrast, the massive Port of Shanghai saw a 71% increase over the last decade, and many other Chinese ports has seen significant growth in volume in recent years.
If China’s One Belt One Road initiatives and investments in global port facilities are any indication, the country’s domination of maritime shipping will only continue to strengthen in the near term.


Markets
U.S. Debt Interest Payments Reach $1 Trillion
U.S. debt interest payments have surged past the $1 trillion dollar mark, amid high interest rates and an ever-expanding debt burden.


U.S. Debt Interest Payments Reach $1 Trillion
This was originally posted on our Voronoi app. Download the app for free on iOS or Android and discover incredible data-driven charts from a variety of trusted sources.
The cost of paying for America’s national debt crossed the $1 trillion dollar mark in 2023, driven by high interest rates and a record $34 trillion mountain of debt.
Over the last decade, U.S. debt interest payments have more than doubled amid vast government spending during the pandemic crisis. As debt payments continue to soar, the Congressional Budget Office (CBO) reported that debt servicing costs surpassed defense spending for the first time ever this year.
This graphic shows the sharp rise in U.S. debt payments, based on data from the Federal Reserve.
A $1 Trillion Interest Bill, and Growing
Below, we show how U.S. debt interest payments have risen at a faster pace than at another time in modern history:
| Date | Interest Payments | U.S. National Debt |
|---|---|---|
| 2023 | $1.0T | $34.0T |
| 2022 | $830B | $31.4T |
| 2021 | $612B | $29.6T |
| 2020 | $518B | $27.7T |
| 2019 | $564B | $23.2T |
| 2018 | $571B | $22.0T |
| 2017 | $493B | $20.5T |
| 2016 | $460B | $20.0T |
| 2015 | $435B | $18.9T |
| 2014 | $442B | $18.1T |
| 2013 | $425B | $17.2T |
| 2012 | $417B | $16.4T |
| 2011 | $433B | $15.2T |
| 2010 | $400B | $14.0T |
| 2009 | $354B | $12.3T |
| 2008 | $380B | $10.7T |
| 2007 | $414B | $9.2T |
| 2006 | $387B | $8.7T |
| 2005 | $355B | $8.2T |
| 2004 | $318B | $7.6T |
| 2003 | $294B | $7.0T |
| 2002 | $298B | $6.4T |
| 2001 | $318B | $5.9T |
| 2000 | $353B | $5.7T |
| 1999 | $353B | $5.8T |
| 1998 | $360B | $5.6T |
| 1997 | $368B | $5.5T |
| 1996 | $362B | $5.3T |
| 1995 | $357B | $5.0T |
| 1994 | $334B | $4.8T |
| 1993 | $311B | $4.5T |
| 1992 | $306B | $4.2T |
| 1991 | $308B | $3.8T |
| 1990 | $298B | $3.4T |
| 1989 | $275B | $3.0T |
| 1988 | $254B | $2.7T |
| 1987 | $240B | $2.4T |
| 1986 | $225B | $2.2T |
| 1985 | $219B | $1.9T |
| 1984 | $205B | $1.7T |
| 1983 | $176B | $1.4T |
| 1982 | $157B | $1.2T |
| 1981 | $142B | $1.0T |
| 1980 | $113B | $930.2B |
| 1979 | $96B | $845.1B |
| 1978 | $84B | $789.2B |
| 1977 | $69B | $718.9B |
| 1976 | $61B | $653.5B |
| 1975 | $55B | $576.6B |
| 1974 | $50B | $492.7B |
| 1973 | $45B | $469.1B |
| 1972 | $39B | $448.5B |
| 1971 | $36B | $424.1B |
| 1970 | $35B | $389.2B |
| 1969 | $30B | $368.2B |
| 1968 | $25B | $358.0B |
| 1967 | $23B | $344.7B |
| 1966 | $21B | $329.3B |
Interest payments represent seasonally adjusted annual rate at the end of Q4.
At current rates, the U.S. national debt is growing by a remarkable $1 trillion about every 100 days, equal to roughly $3.6 trillion per year.
As the national debt has ballooned, debt payments even exceeded Medicaid outlays in 2023—one of the government’s largest expenditures. On average, the U.S. spent more than $2 billion per day on interest costs last year. Going further, the U.S. government is projected to spend a historic $12.4 trillion on interest payments over the next decade, averaging about $37,100 per American.
Exacerbating matters is that the U.S. is running a steep deficit, which stood at $1.1 trillion for the first six months of fiscal 2024. This has accelerated due to the 43% increase in debt servicing costs along with a $31 billion dollar increase in defense spending from a year earlier. Additionally, a $30 billion increase in funding for the Federal Deposit Insurance Corporation in light of the regional banking crisis last year was a major contributor to the deficit increase.
Overall, the CBO forecasts that roughly 75% of the federal deficit’s increase will be due to interest costs by 2034.

-

 Real Estate2 weeks ago
Visualizing America’s Shortage of Affordable Homes
-

 Technology1 week ago
Ranked: Semiconductor Companies by Industry Revenue Share
-

 Money2 weeks ago
Which States Have the Highest Minimum Wage in America?
-

 Real Estate2 weeks ago
Ranked: The Most Valuable Housing Markets in America
-

 Business2 weeks ago
Charted: Big Four Market Share by S&P 500 Audits
-

 AI2 weeks ago
The Stock Performance of U.S. Chipmakers So Far in 2024
-

 Misc2 weeks ago
Almost Every EV Stock is Down After Q1 2024
-

 Money2 weeks ago
Where Does One U.S. Tax Dollar Go?