Agriculture
Visualizing the World’s Biggest Rice Producers
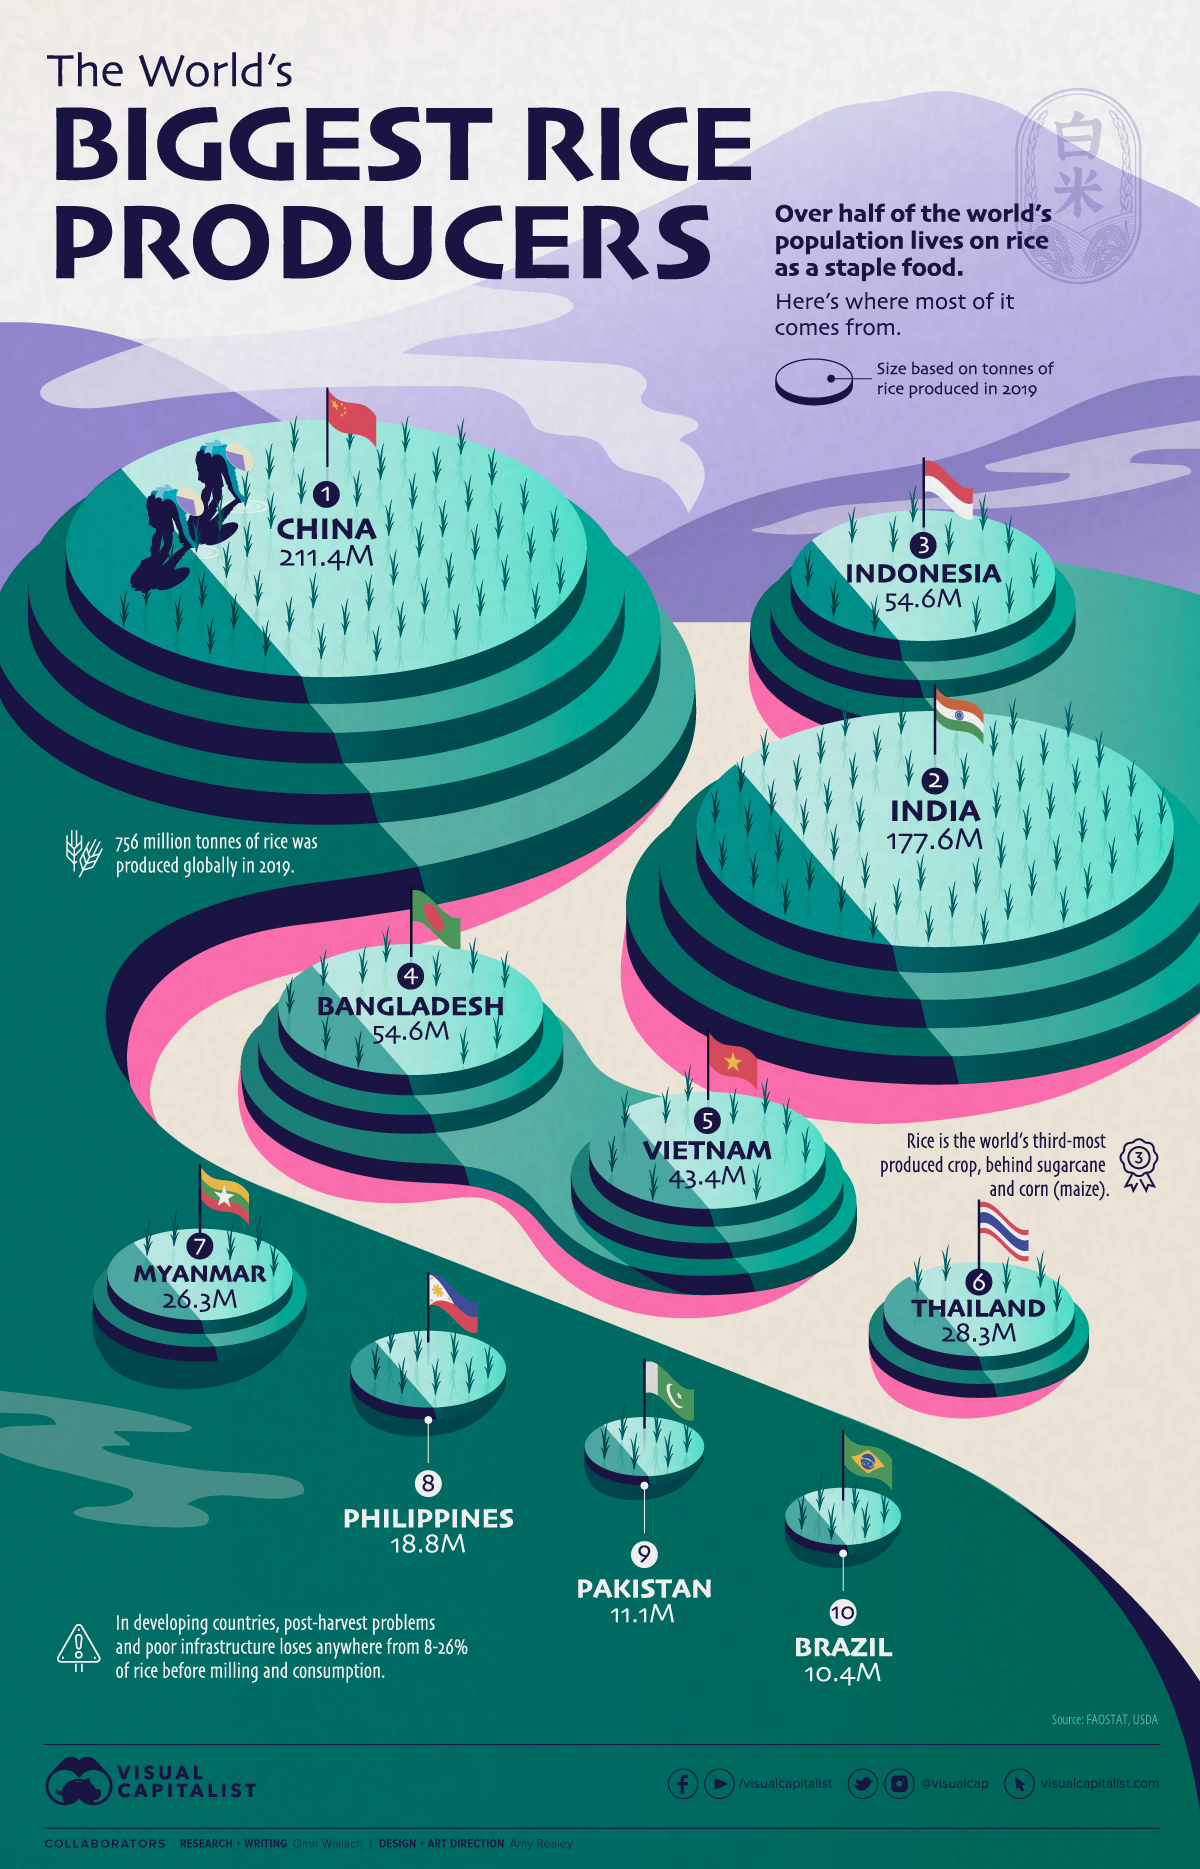


Visualizing The World’s Biggest Rice Producers
It’s hard to overstate the importance of rice to the world.
As a staple food, over half of the global population depends on the crop as a major part of their diet. In fact, rice is considered a vital part of nutrition in much of Asia, Latin America, Africa, and the Caribbean, and is estimated to provide more than one-fifth of the calories consumed worldwide by humans.
This graphic highlights the world’s 10 biggest rice-producing countries, using 2019 production data from the UN’s FAOSTAT and the USDA.
Which Countries Produce the Most Rice?
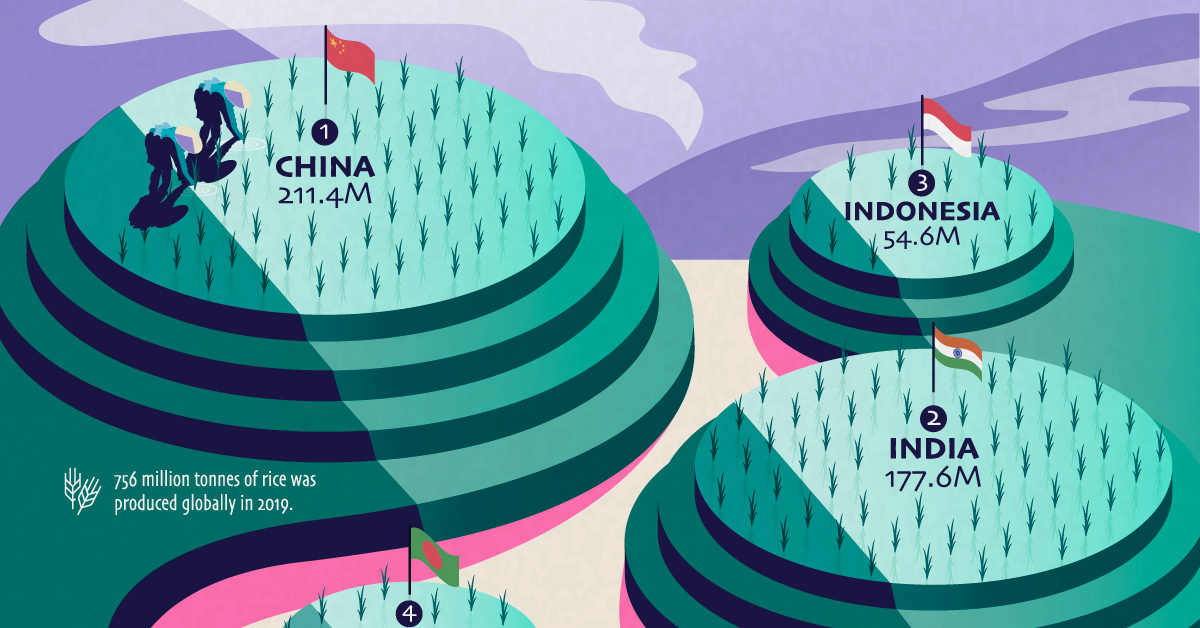
With 756 million tonnes produced globally in 2019, rice is the world’s third-most produced agricultural crop behind sugarcane and corn (maize), which both have a wide variety of non-consumption uses.
Just 10 countries are responsible for a bulk of global rice production:
| Country | Tonnes Rice Produced (2019) | % of Total |
|---|---|---|
| China | 211.4M | 28.0% |
| India | 177.6M | 23.5% |
| Indonesia | 54.6M | 7.2% |
| Bangladesh | 54.6M | 7.2% |
| Vietnam | 43.4M | 5.7% |
| Thailand | 28.3M | 3.7% |
| Myanmar | 26.3M | 3.5% |
| Philippines | 18.8M | 2.5% |
| Pakistan | 11.1M | 1.5% |
| Brazil | 10.4M | 1.4% |
| Others | 119.0M | 15.8% |
| Total | 755.5M | 100.0% |
At the top of the charts are China (#1) and India (#2), which produced 389 million tonnes combined, accounting for more than half of global production.
They’re significantly ahead of #3 and #4 countries Indonesia and Bangladesh, which produced around 54.6 million tonnes each. Almost all of the top producers are located in Asia, with the exception of Brazil (#10).
Feeding A Growing World
With 84% of rice being harvested in just 10 countries, it’s clear that many countries globally must rely on imports to meet domestic demand.
In 2019, India, Thailand, Pakistan, and Vietnam were large net exporters of rice, shipping out nearly $16 billion of rice combined. Other countries including Iran, China, Saudi Arabia, and the Philippines consume above production numbers and rely on imports to meet their needs.
And not everything makes it from plant to table. In developing countries especially, estimates of 8–26% of rice are lost due to postharvest problems and poor infrastructure.
As the global population continues to grow, rice will continue to be a key source of calories around the world—and as our diets change, it’ll be interesting to see how that role shifts in the future.


Markets
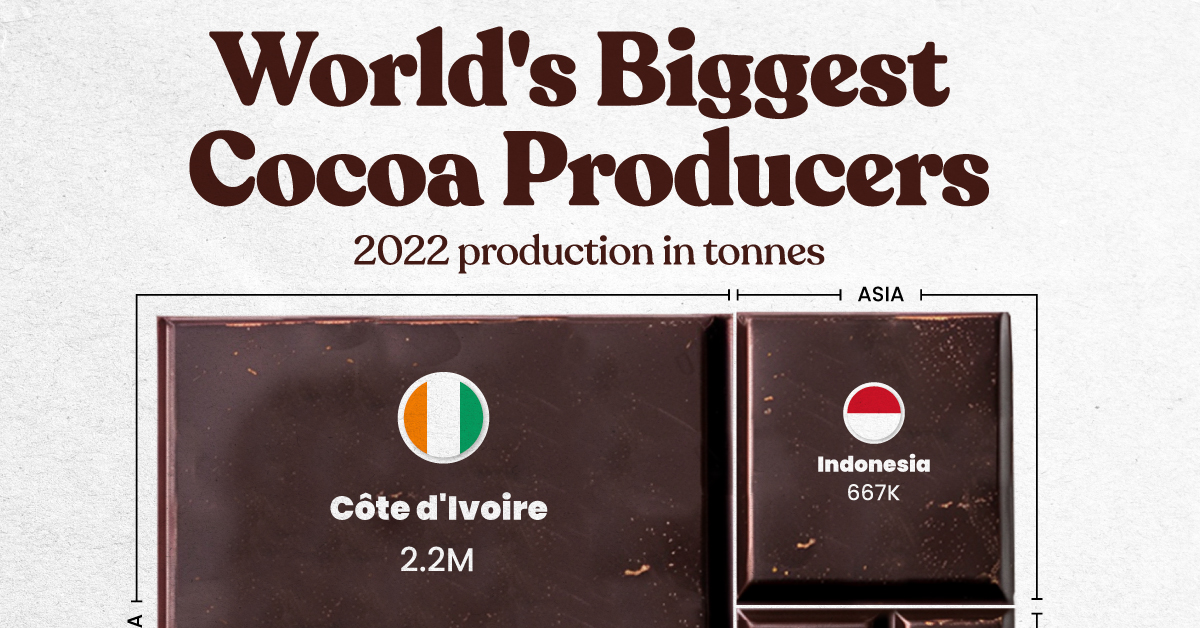
The World’s Top Cocoa Producing Countries
Here are the largest cocoa producing countries globally—from Côte d’Ivoire to Brazil—as cocoa prices hit record highs.
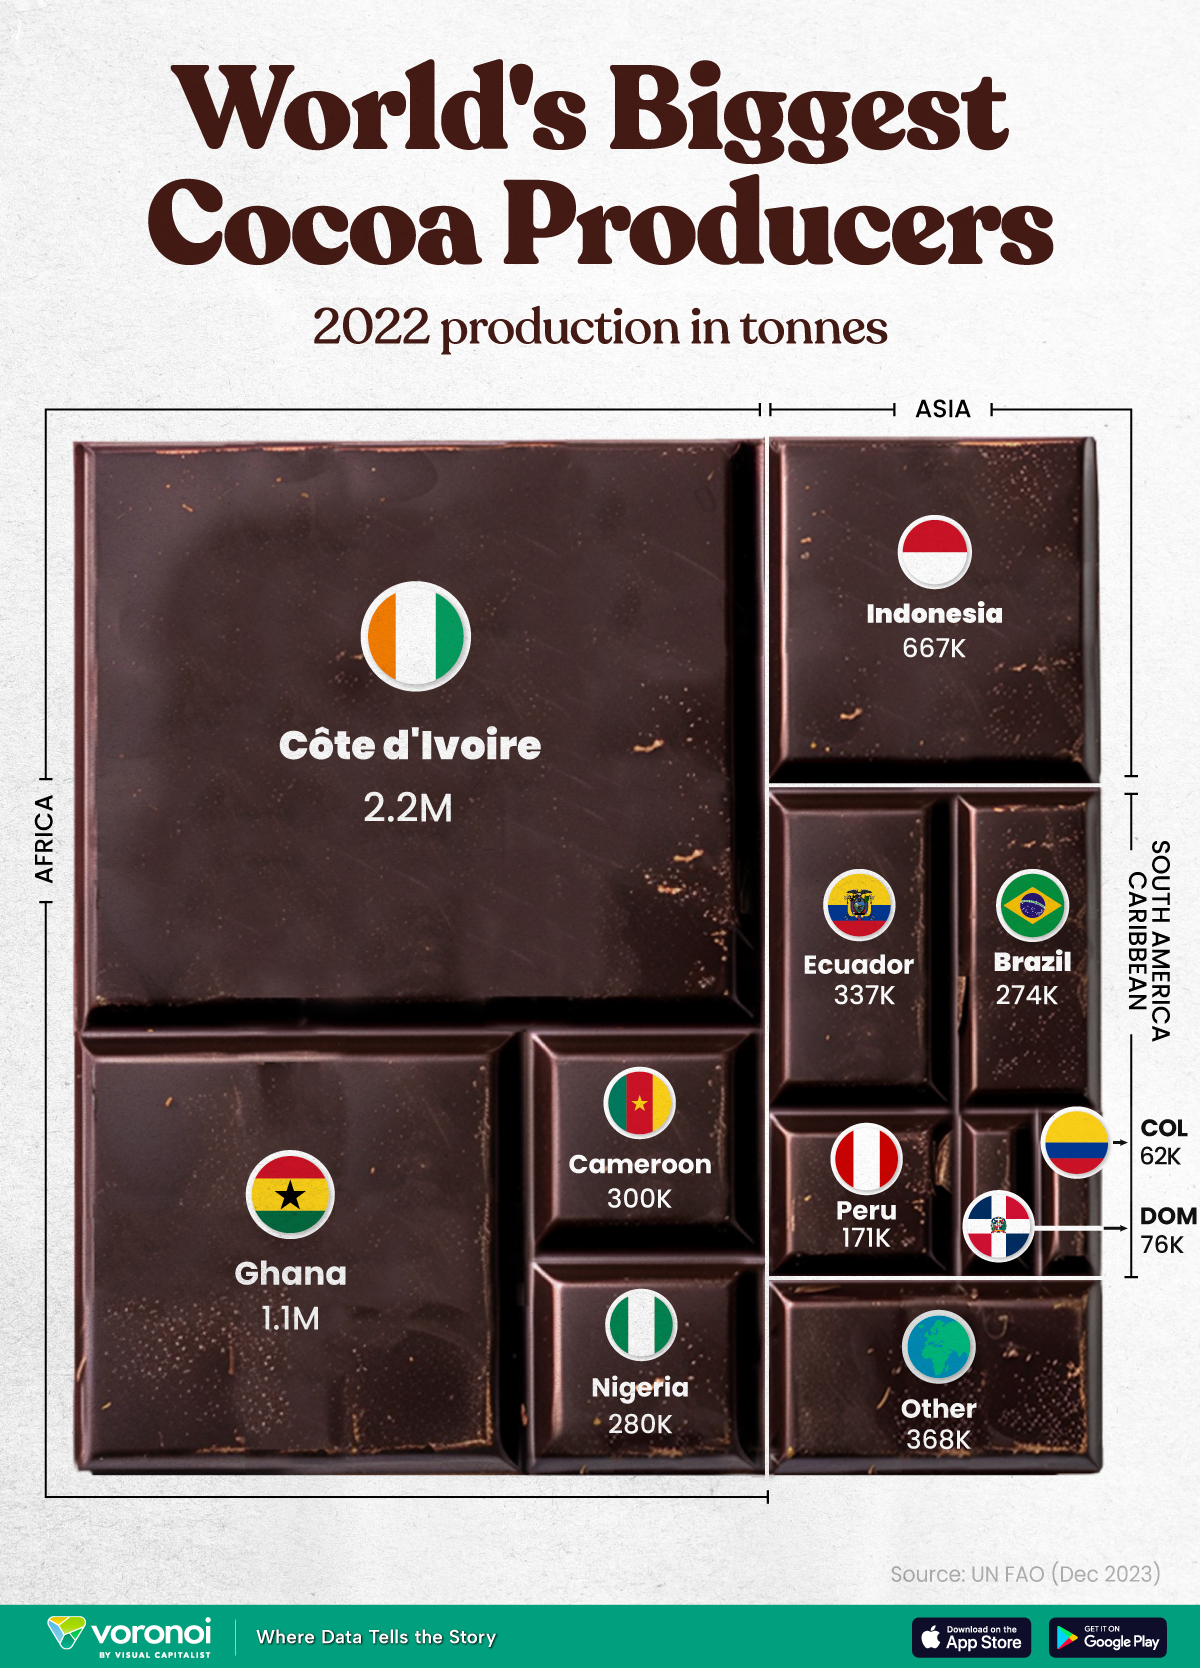
The World’s Top Cocoa Producing Countries
This was originally posted on our Voronoi app. Download the app for free on iOS or Android and discover incredible data-driven charts from a variety of trusted sources.
West Africa is home to the largest cocoa producing countries worldwide, with 3.9 million tonnes of production in 2022.
In fact, there are about one million farmers in Côte d’Ivoire supplying cocoa to key customers such as Nestlé, Mars, and Hershey. But the massive influence of this industry has led to significant forest loss to plant cocoa trees.
This graphic shows the leading producers of cocoa, based on data from the UN FAO.
Global Hotspots for Cocoa Production
Below, we break down the top cocoa producing countries as of 2022:
| Country | 2022 Production, Tonnes |
|---|---|
| 🇨🇮 Côte d'Ivoire | 2.2M |
| 🇬🇭 Ghana | 1.1M |
| 🇮🇩 Indonesia | 667K |
| 🇪🇨 Ecuador | 337K |
| 🇨🇲 Cameroon | 300K |
| 🇳🇬 Nigeria | 280K |
| 🇧🇷 Brazil | 274K |
| 🇵🇪 Peru | 171K |
| 🇩🇴 Dominican Republic | 76K |
| 🌍 Other | 386K |
With 2.2 million tonnes of cocoa in 2022, Côte d’Ivoire is the world’s largest producer, accounting for a third of the global total.
For many reasons, the cocoa trade in Côte d’Ivoire and Western Africa has been controversial. Often, farmers make about 5% of the retail price of a chocolate bar, and earn $1.20 each day. Adding to this, roughly a third of cocoa farms operate on forests that are meant to be protected.
As the third largest producer, Indonesia produced 667,000 tonnes of cocoa with the U.S., Malaysia, and Singapore as major importers. Overall, small-scale farmers produce 95% of cocoa in the country, but face several challenges such as low pay and unwanted impacts from climate change. Alongside aging trees in the country, these setbacks have led productivity to decline.
In South America, major producers include Ecuador and Brazil. In the early 1900s, Ecuador was the world’s largest cocoa producing country, however shifts in the global marketplace and crop disease led its position to fall. Today, the country is most known for its high-grade single-origin chocolate, with farms seen across the Amazon rainforest.
Altogether, global cocoa production reached 6.5 million tonnes, supported by strong demand. On average, the market has grown 3% annually over the last several decades.

-

 Maps2 weeks ago
Mapped: Average Wages Across Europe
-

 Money1 week ago
Which States Have the Highest Minimum Wage in America?
-

 Real Estate1 week ago
Ranked: The Most Valuable Housing Markets in America
-

 Markets1 week ago
Charted: Big Four Market Share by S&P 500 Audits
-

 AI1 week ago
The Stock Performance of U.S. Chipmakers So Far in 2024
-

 Automotive1 week ago
Almost Every EV Stock is Down After Q1 2024
-

 Money2 weeks ago
Where Does One U.S. Tax Dollar Go?
-

 Green2 weeks ago
Ranked: Top Countries by Total Forest Loss Since 2001