Markets
Ranked: The World’s 100 Biggest Pension Funds
View the full-resolution version of this infographic


Ranked: The World’s 100 Biggest Pension Funds
View the high-resolution of the infographic by clicking here.
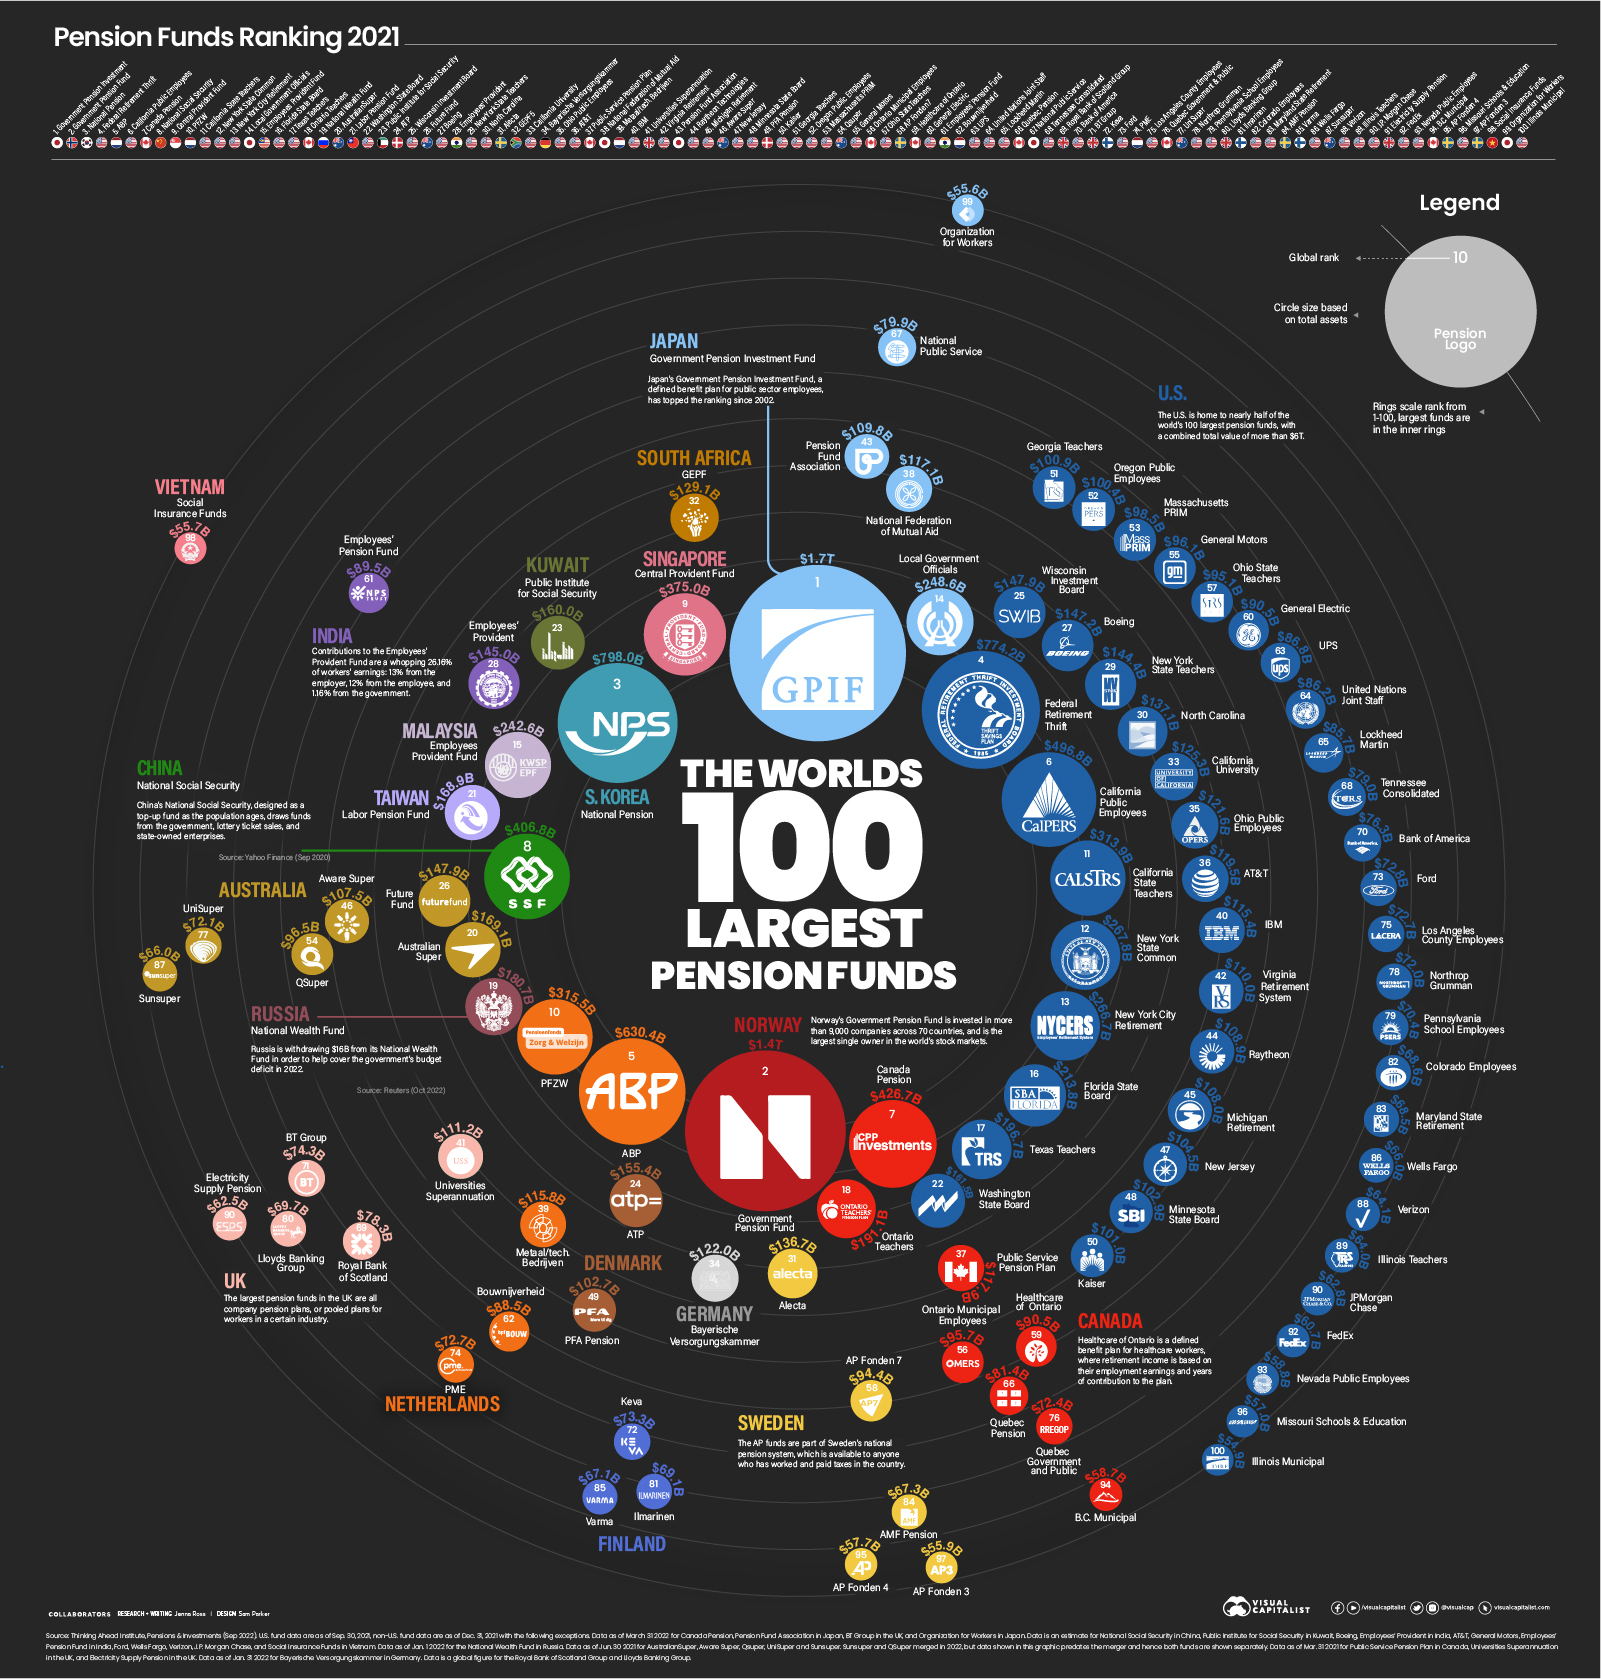
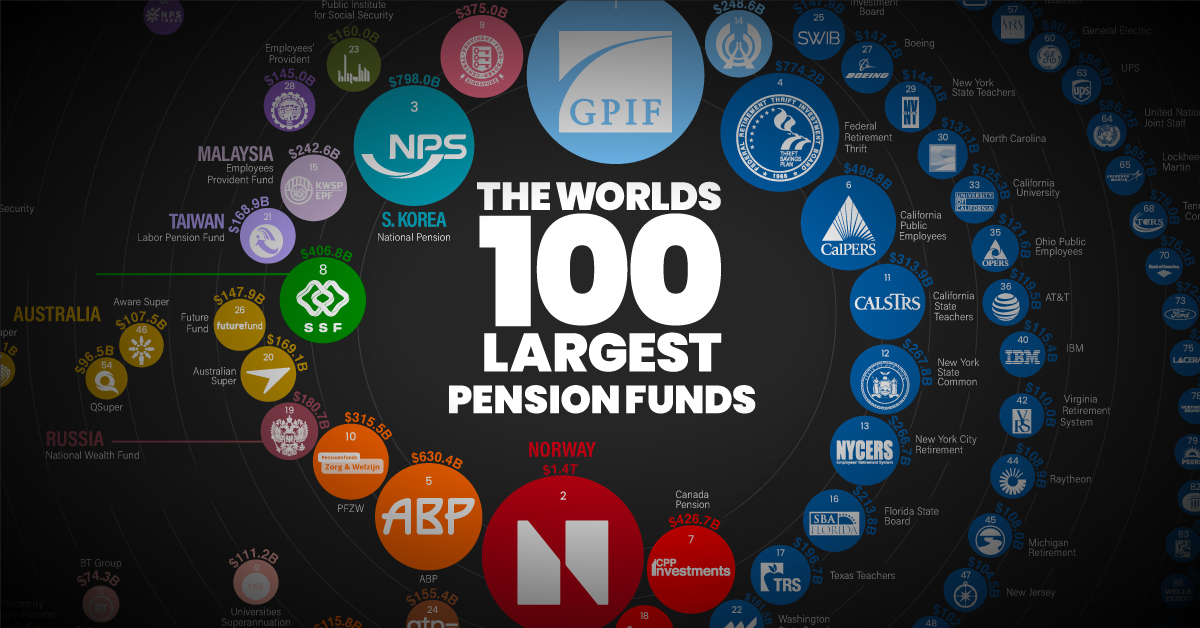
Despite economic uncertainty, pension funds saw relatively strong growth in 2021. The world’s 100 biggest pension funds are worth over $17 trillion in total, an increase of 8.5% over the previous year.
This graphic uses data from the Thinking Ahead Institute to rank the world’s biggest pension funds, and where they are located.
What is a Pension Fund?
A pension fund is a fund that is designed to provide retirement income. This ranking covers four different types:
- Sovereign funds: Funds controlled directly by the state. This ranking only includes sovereign funds that are established by national authorities.
- Public sector funds: Funds that cover public sector workers, such as government employees and teachers, in provincial or state sponsored plans.
- Private independent funds: Funds controlled by private sector organizations that are authorized to manage pension plans from different employers.
- Corporate funds: Funds that cover workers in company sponsored pension plans.
Among the largest funds, public sector funds are the most common.
The Largest Pension Funds, Ranked
Here are the top 100 pension funds, organized from largest to smallest.
| Rank | Fund | Market | Total Assets |
|---|---|---|---|
| 1 | Government Pension Investment Fund | 🇯🇵 Japan | $1.7T |
| 2 | Government Pension Fund | 🇳🇴 Norway | $1.4T |
| 3 | National Pension | 🇰🇷 South Korea | $798.0B |
| 4 | Federal Retirement Thrift | 🇺🇸 U.S. | $774.2B |
| 5 | ABP | 🇳🇱 Netherlands | $630.4B |
| 6 | California Public Employees | 🇺🇸 U.S. | $496.8B |
| 7 | Canada Pension | 🇨🇦 Canada | $426.7B |
| 8 | National Social Security | 🇨🇳 China | $406.8B |
| 9 | Central Provident Fund | 🇸🇬 Singapore | $375.0B |
| 10 | PFZW | 🇳🇱 Netherlands | $315.5B |
| 11 | California State Teachers | 🇺🇸 U.S. | $313.9B |
| 12 | New York State Common | 🇺🇸 U.S. | $267.8B |
| 13 | New York City Retirement | 🇺🇸 U.S. | $266.7B |
| 14 | Local Government Officials | 🇯🇵 Japan | $248.6B |
| 15 | Employees Provident Fund | 🇲🇾 Malaysia | $242.6B |
| 16 | Florida State Board | 🇺🇸 U.S. | $213.8B |
| 17 | Texas Teachers | 🇺🇸 U.S. | $196.7B |
| 18 | Ontario Teachers | 🇨🇦 Canada | $191.1B |
| 19 | National Wealth Fund | 🇷🇺 Russia | $180.7B |
| 20 | AustralianSuper | 🇦🇺 Australia | $169.1B |
| 21 | Labor Pension Fund | 🇹🇼 Taiwan | $168.9B |
| 22 | Washington State Board | 🇺🇸 U.S. | $161.5B |
| 23 | Public Institute for Social Security | 🇰🇼 Kuwait | $160.0B |
| 24 | ATP | 🇩🇰 Denmark | $155.4B |
| 25 | Wisconsin Investment Board | 🇺🇸 U.S. | $147.9B |
| 26 | Future Fund | 🇦🇺 Australia | $147.9B |
| 27 | Boeing | 🇺🇸 U.S. | $147.2B |
| 28 | Employees' Provident | 🇮🇳 India | $145.0B |
| 29 | New York State Teachers | 🇺🇸 U.S. | $144.4B |
| 30 | North Carolina | 🇺🇸 U.S. | $137.1B |
| 31 | Alecta | 🇸🇪 Sweden | $136.7B |
| 32 | GEPF | 🇿🇦 South Africa | $129.1B |
| 33 | California University | 🇺🇸 U.S. | $125.3B |
| 34 | Bayerische Versorgungskammer | 🇩🇪 Germany | $122.0B |
| 35 | Ohio Public Employees | 🇺🇸 U.S. | $121.6B |
| 36 | AT&T | 🇺🇸 U.S. | $119.5B |
| 37 | Public Service Pension Plan | 🇨🇦 Canada | $117.9B |
| 38 | National Federation of Mutual Aid | 🇯🇵 Japan | $117.1B |
| 39 | Metaal/tech. Bedrijven | 🇳🇱 Netherlands | $115.8B |
| 40 | IBM | 🇺🇸 U.S. | $115.4B |
| 41 | Universities Superannuation | 🇬🇧 UK | $111.2B |
| 42 | Virginia Retirement | 🇺🇸 U.S. | $110.0B |
| 43 | Pension Fund Association | 🇯🇵 Japan | $109.8B |
| 44 | Raytheon Technologies | 🇺🇸 U.S. | $108.9B |
| 45 | Michigan Retirement | 🇺🇸 U.S. | $108.0B |
| 46 | Aware Super | 🇦🇺 Australia | $107.5B |
| 47 | New Jersey | 🇺🇸 U.S. | $104.5B |
| 48 | Minnesota State Board | 🇺🇸 U.S. | $102.9B |
| 49 | PFA Pension | 🇩🇰 Denmark | $102.7B |
| 50 | Kaiser | 🇺🇸 U.S. | $101.0B |
| 51 | Georgia Teachers | 🇺🇸 U.S. | $100.9B |
| 52 | Oregon Public Employees | 🇺🇸 U.S. | $100.4B |
| 53 | Massachusetts PRIM | 🇺🇸 U.S. | $98.5B |
| 54 | Qsuper | 🇦🇺 Australia | $96.5B |
| 55 | General Motors | 🇺🇸 U.S. | $96.1B |
| 56 | Ontario Municipal Employees | 🇨🇦 Canada | $95.7B |
| 57 | Ohio State Teachers | 🇺🇸 U.S. | $95.1B |
| 58 | AP Fonden 7 | 🇸🇪 Sweden | $94.4B |
| 59 | Healthcare of Ontario | 🇨🇦 Canada | $90.5B |
| 60 | General Electric | 🇺🇸 U.S. | $90.5B |
| 61 | Employees' Pension Fund | 🇮🇳 India | $89.5B |
| 62 | Bouwnijverheid | 🇳🇱 Netherlands | $88.5B |
| 63 | UPS | 🇺🇸 U.S. | $86.8B |
| 64 | United Nations Joint Staff | 🇺🇸 U.S. | $86.2B |
| 65 | Lockheed Martin | 🇺🇸 U.S. | $85.7B |
| 66 | Quebec Pension | 🇨🇦 Canada | $81.4B |
| 67 | National Public Service | 🇯🇵 Japan | $79.9B |
| 68 | Tennessee Consolidated | 🇺🇸 U.S. | $79.0B |
| 69 | Royal Bank of Scotland Group | 🇬🇧 UK | $78.3B |
| 70 | Bank of America | 🇺🇸 U.S. | $76.3B |
| 71 | BT Group | 🇬🇧 UK | $74.3B |
| 72 | Keva | 🇫🇮 Finland | $73.3B |
| 73 | Ford | 🇺🇸 U.S. | $72.8B |
| 74 | PME | 🇳🇱 Netherlands | $72.7B |
| 75 | Los Angeles County Employees | 🇺🇸 U.S. | $72.7B |
| 76 | Quebec Government & Public | 🇨🇦 Canada | $72.4B |
| 77 | UniSuper | 🇦🇺 Australia | $72.1B |
| 78 | Northrop Grumman | 🇺🇸 U.S. | $72.0B |
| 79 | Pennsylvania School Employees | 🇺🇸 U.S. | $70.4B |
| 80 | Lloyds Banking Group | 🇬🇧 UK | $69.7B |
| 81 | Ilmarinen | 🇫🇮 Finland | $69.1B |
| 82 | Colorado Employees | 🇺🇸 U.S. | $68.6B |
| 83 | Maryland State Retirement | 🇺🇸 U.S. | $68.5B |
| 84 | AMF Pension | 🇸🇪 Sweden | $67.3B |
| 85 | Varma | 🇫🇮 Finland | $67.1B |
| 86 | Wells Fargo | 🇺🇸 U.S. | $66.0B |
| 87 | Sunsuper | 🇦🇺 Australia | $66.0B |
| 88 | Verizon | 🇺🇸 U.S. | $64.1B |
| 89 | Illinois Teachers | 🇺🇸 U.S. | $64.0B |
| 90 | J.P. Morgan Chase | 🇺🇸 U.S. | $62.8B |
| 91 | Electricity Supply Pension | 🇬🇧 UK | $62.5B |
| 92 | FedEx | 🇺🇸 U.S. | $60.7B |
| 93 | Nevada Public Employees | 🇺🇸 U.S. | $58.8B |
| 94 | B.C. Municipal | 🇨🇦 Canada | $58.7B |
| 95 | AP Fonden 4 | 🇸🇪 Sweden | $57.7B |
| 96 | Missouri Schools & Education | 🇺🇸 U.S. | $57.0B |
| 97 | AP Fonden 3 | 🇸🇪 Sweden | $55.9B |
| 98 | Social Insurance Funds | 🇻🇳 Vietnam | $55.7B |
| 99 | Organization for Workers | 🇯🇵 Japan | $55.6B |
| 100 | Illinois Municipal | 🇺🇸 U.S. | $54.9B |
U.S. fund data are as of Sep. 30, 2021, and non-U.S. fund data are as of Dec. 31, 2021. There are some exceptions as noted in the graphic footnotes.
Japan’s Government Pension Investment Fund (GPIF) is the largest in the ranking for the 21st year in a row. For a time, the fund was the largest holder of domestic stocks in Japan, though the Bank of Japan has since taken that title. Given its enormous size, investors closely follow the GPIF’s actions. For instance, the fund made headlines for deciding to start investing in startups, because the move could entice other pensions to make similar investments.
America is home to 47 funds on the list, including the largest public sector fund: the Thrift Savings Plan (TSP), overseen by the Federal Retirement Thrift Investment Board. Because of its large financial influence, both political parties have been accused of using it as a political tool. Democrats have pushed to divest assets in fossil fuel companies, while Republicans have proposed blocking investment in Chinese-owned companies.
Russia’s National Wealth Fund comes in at number 19 on the list. The fund is designed to support the public pension system and help balance the budget as needed. With Russia’s economy facing difficulties amid the Russia-Ukraine conflict, the government has also used it as a rainy day fund. For instance, Russia has set aside $23 billion from the fund to replace foreign aircraft with domestic models, because Western sanctions have made it difficult to source replacement parts for foreign planes.
The Future of Pension Funds
The biggest pension funds can have a large influence in the market because of their size. Of course, they are also responsible for providing retirement income to millions of people. Pension funds face a variety of challenges in order to reach their goals:
- Geopolitical conflict creates volatility and uncertainty
- High inflation and low interest rates (relative to long-term averages) limit return potential
- Aging populations mean more withdrawals and less fund contributions
Some pension funds are turning to alternative assets, such as private equity, in pursuit of more diversification and higher returns. Of course, these investments can also carry more risk.
Ontario Teachers’ Pension Plan, number 18 on the list, invested $95 million in the now-bankrupt cryptocurrency exchange FTX. The plan made the investment through its venture growth platform, to “gain small-scale exposure to an emerging area in the financial technology sector.”
In this case, the investment’s failure is expected to have a minimal impact given it only made up 0.05% of the plan’s net assets. However, it does highlight the challenges pension funds face to generate sufficient returns in a variety of macroeconomic environments.


Economy
Economic Growth Forecasts for G7 and BRICS Countries in 2024
The IMF has released its economic growth forecasts for 2024. How do the G7 and BRICS countries compare?


G7 & BRICS Real GDP Growth Forecasts for 2024
The International Monetary Fund’s (IMF) has released its real gross domestic product (GDP) growth forecasts for 2024, and while global growth is projected to stay steady at 3.2%, various major nations are seeing declining forecasts.
This chart visualizes the 2024 real GDP growth forecasts using data from the IMF’s 2024 World Economic Outlook for G7 and BRICS member nations along with Saudi Arabia, which is still considering an invitation to join the bloc.
Get the Key Insights of the IMF’s World Economic Outlook
Want a visual breakdown of the insights from the IMF’s 2024 World Economic Outlook report?
This visual is part of a special dispatch of the key takeaways exclusively for VC+ members.
Get the full dispatch of charts by signing up to VC+.
Mixed Economic Growth Prospects for Major Nations in 2024
Economic growth projections by the IMF for major nations are mixed, with the majority of G7 and BRICS countries forecasted to have slower growth in 2024 compared to 2023.
Only three BRICS-invited or member countries, Saudi Arabia, the UAE, and South Africa, have higher projected real GDP growth rates in 2024 than last year.
| Group | Country | Real GDP Growth (2023) | Real GDP Growth (2024P) |
|---|---|---|---|
| G7 | 🇺🇸 U.S. | 2.5% | 2.7% |
| G7 | 🇨🇦 Canada | 1.1% | 1.2% |
| G7 | 🇯🇵 Japan | 1.9% | 0.9% |
| G7 | 🇫🇷 France | 0.9% | 0.7% |
| G7 | 🇮🇹 Italy | 0.9% | 0.7% |
| G7 | 🇬🇧 UK | 0.1% | 0.5% |
| G7 | 🇩🇪 Germany | -0.3% | 0.2% |
| BRICS | 🇮🇳 India | 7.8% | 6.8% |
| BRICS | 🇨🇳 China | 5.2% | 4.6% |
| BRICS | 🇦🇪 UAE | 3.4% | 3.5% |
| BRICS | 🇮🇷 Iran | 4.7% | 3.3% |
| BRICS | 🇷🇺 Russia | 3.6% | 3.2% |
| BRICS | 🇪🇬 Egypt | 3.8% | 3.0% |
| BRICS-invited | 🇸🇦 Saudi Arabia | -0.8% | 2.6% |
| BRICS | 🇧🇷 Brazil | 2.9% | 2.2% |
| BRICS | 🇿🇦 South Africa | 0.6% | 0.9% |
| BRICS | 🇪🇹 Ethiopia | 7.2% | 6.2% |
| 🌍 World | 3.2% | 3.2% |
China and India are forecasted to maintain relatively high growth rates in 2024 at 4.6% and 6.8% respectively, but compared to the previous year, China is growing 0.6 percentage points slower while India is an entire percentage point slower.
On the other hand, four G7 nations are set to grow faster than last year, which includes Germany making its comeback from its negative real GDP growth of -0.3% in 2023.
Faster Growth for BRICS than G7 Nations
Despite mostly lower growth forecasts in 2024 compared to 2023, BRICS nations still have a significantly higher average growth forecast at 3.6% compared to the G7 average of 1%.
While the G7 countries’ combined GDP is around $15 trillion greater than the BRICS nations, with continued higher growth rates and the potential to add more members, BRICS looks likely to overtake the G7 in economic size within two decades.
BRICS Expansion Stutters Before October 2024 Summit
BRICS’ recent expansion has stuttered slightly, as Argentina’s newly-elected president Javier Milei declined its invitation and Saudi Arabia clarified that the country is still considering its invitation and has not joined BRICS yet.
Even with these initial growing pains, South Africa’s Foreign Minister Naledi Pandor told reporters in February that 34 different countries have submitted applications to join the growing BRICS bloc.
Any changes to the group are likely to be announced leading up to or at the 2024 BRICS summit which takes place October 22-24 in Kazan, Russia.
Get the Full Analysis of the IMF’s Outlook on VC+
This visual is part of an exclusive special dispatch for VC+ members which breaks down the key takeaways from the IMF’s 2024 World Economic Outlook.
For the full set of charts and analysis, sign up for VC+.

-

 Markets1 week ago
U.S. Debt Interest Payments Reach $1 Trillion
-

 Markets2 weeks ago
Ranked: The Most Valuable Housing Markets in America
-

 Money2 weeks ago
Which States Have the Highest Minimum Wage in America?
-

 AI2 weeks ago
Ranked: Semiconductor Companies by Industry Revenue Share
-

 Markets2 weeks ago
Ranked: The World’s Top Flight Routes, by Revenue
-

 Countries2 weeks ago
Population Projections: The World’s 6 Largest Countries in 2075
-

 Markets2 weeks ago
The Top 10 States by Real GDP Growth in 2023
-

 Money2 weeks ago
The Smallest Gender Wage Gaps in OECD Countries