Demographics
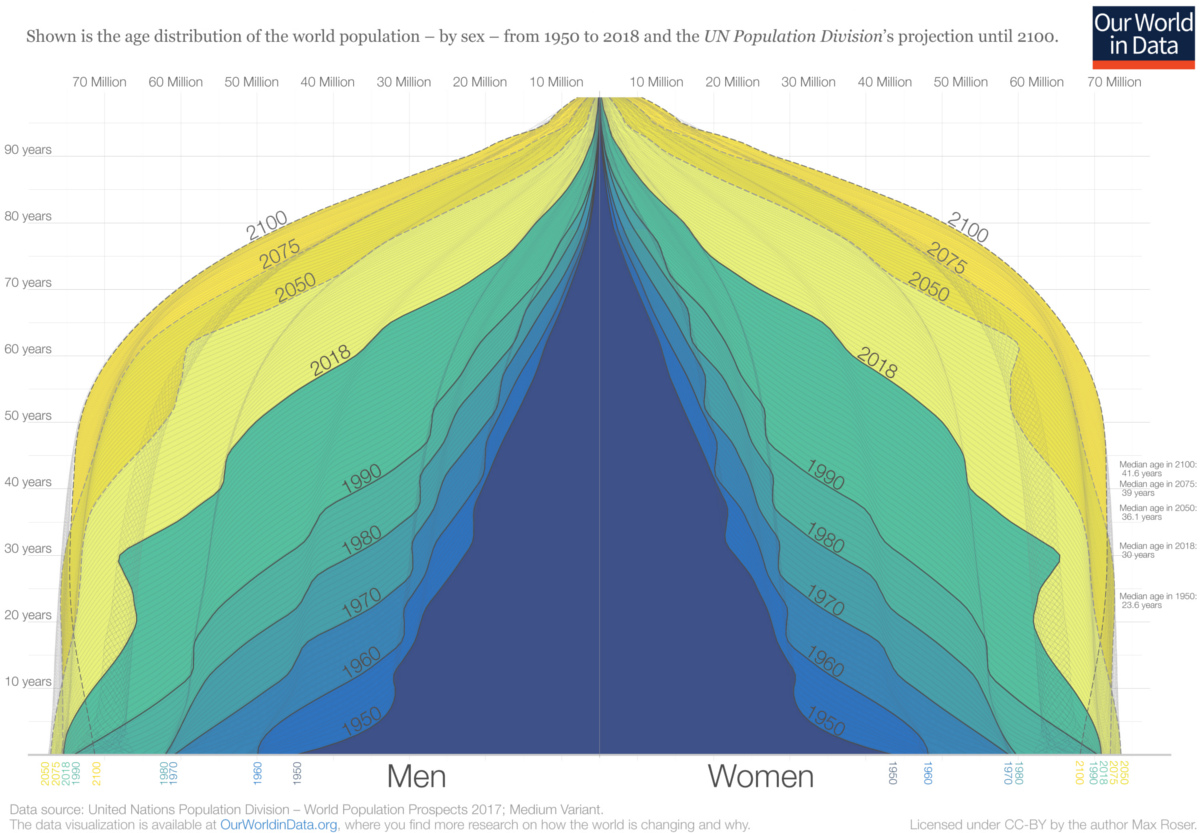
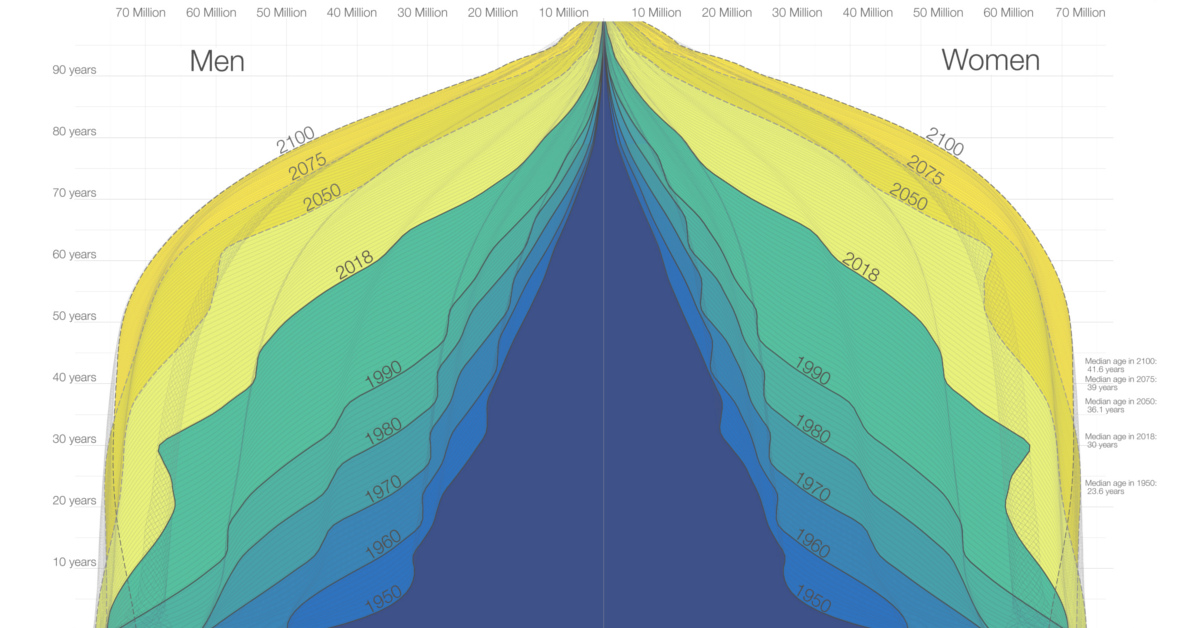
The World Population Pyramid (1950-2100)
Article/Editing:
The world is in the midst of a notable period of demographic transition.
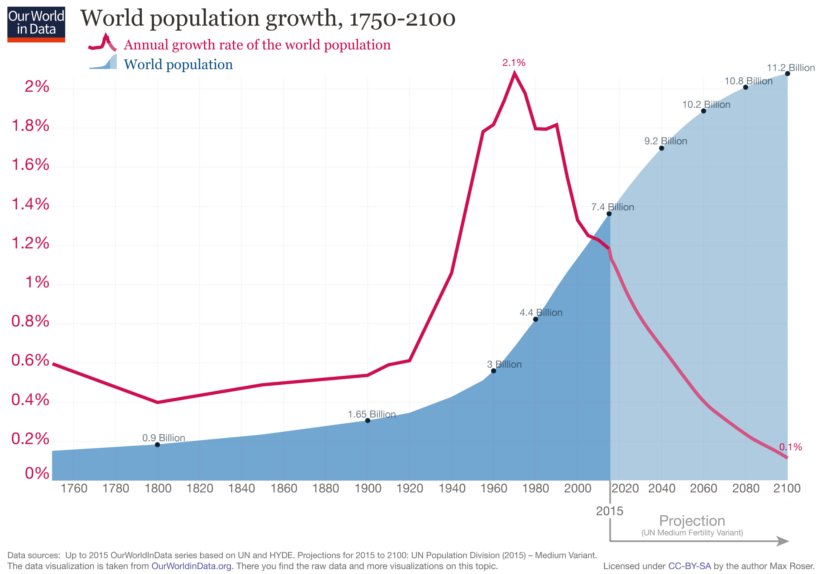
Back in the 1960s, global population growth peaked at a 2.1% annual rate, but since then it has been on a historic downtrend.
In fact, according to the most commonly cited United Nations projection, which is based on a medium fertility rate scenario, it’s expected that annual population growth could drop all the way to 0.1% by the end of the 21st century.
Visualizing a Demographic Transition
Today’s powerful charts come from Our World in Data by economist Max Roser, and they show how global demographics will shift over the next 80 years.
Below you can see one major catalyst of this change, which is the peaking (and then falling) population growth rate:
Why has population growth been dropping since the 1960s?
A variety of explanations factor into this, including:
- Falling fertility rates:
Birth rates tend to fall as nations get richer. First, this happened in the developed world, but as the century progresses this phenomenon will impact more and more developing nations. - Government policy:
China’s “One Child Policy” in particular had an effect on global population growth, and the aftermath of the policy is still contributing to a shrinking Chinese population over the long term. - Rural flight
Urban dwellers tend to have fewer babies—and by 2050, there will be an additional 2.5 billion people living in cities globally.
Fewer births combined with improving healthcare—especially in developing nations—will dramatically alter the composition of the world population pyramid, creating both economic opportunities and challenges in the process.
The Changing World Population Pyramid
The following graphic charts how these changes affect the makeup of the world’s population.
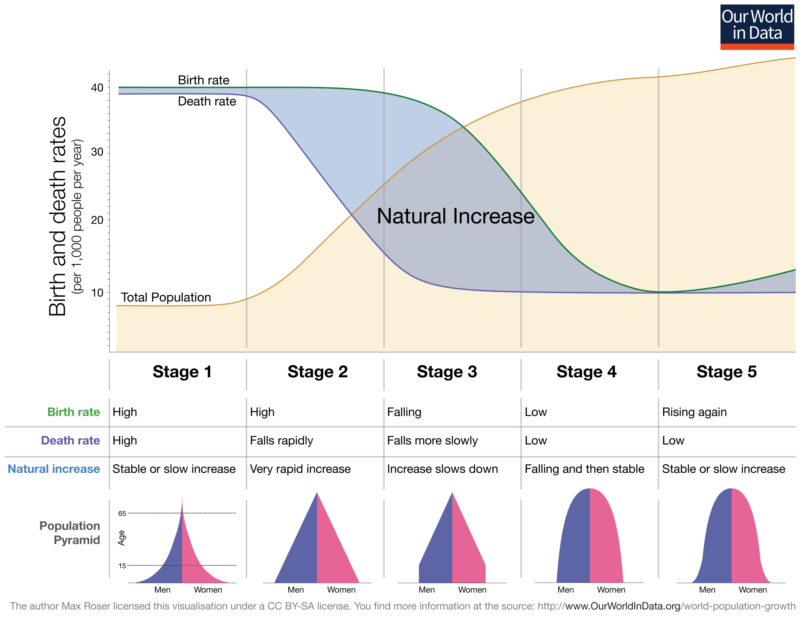
Over time, the shape of the world population pyramid is expected to shift from Stage 1 (high birth rates, high death rates) to something closer to Stage 4 (low birth rates, low death rates).
As the population distribution skews older, here is how population size and global median age will change:
| Year | Global Population Size | Median Age |
|---|---|---|
| 1950 | 2.6 billion | 23.6 years |
| 2018 | 7.6 billion | 30.0 years |
| 2050p | 9.7 billion | 36.1 years |
| 2075p | 10.7 billion | 39.0 years |
| 2100p | 11.2 billion | 41.6 years |
Global median age is projected to surpass 40 years by the end of the century, and it will be considerably higher in many Western nations, especially in Japan and Europe.
With the future demographic composition looking very different than today, it will be fascinating to see how the economy responds to these potential tailwinds. Further, it will be even more interesting to see what role automation will play as the old-age dependency ratio hits historic highs.

This article was published as a part of Visual Capitalist's Creator Program, which features data-driven visuals from some of our favorite Creators around the world.


Demographics
The Countries That Have Become Sadder Since 2010
Tracking Gallup survey data for more than a decade reveals some countries are witnessing big happiness declines, reflecting their shifting socio-economic conditions.


The Countries That Have Become Sadder Since 2010
This was originally posted on our Voronoi app. Download the app for free on iOS or Android and discover incredible data-driven charts from a variety of trusted sources.
Can happiness be quantified?
Some approaches that try to answer this question make a distinction between two differing components of happiness: a daily experience part, and a more general life evaluation (which includes how people think about their life as a whole).
The World Happiness Report—first launched in 2012—has been making a serious go at quantifying happiness, by examining Gallup poll data that asks respondents in nearly every country to evaluate their life on a 0–10 scale. From this they extrapolate a single “happiness score” out of 10 to compare how happy (or unhappy) countries are.
More than a decade later, the 2024 World Happiness Report continues the mission. Its latest findings also include how some countries have become sadder in the intervening years.
Which Countries Have Become Unhappier Since 2010?
Afghanistan is the unhappiest country in the world right now, and is also 60% unhappier than over a decade ago, indicating how much life has worsened since 2010.
In 2021, the Taliban officially returned to power in Afghanistan, after nearly two decades of American occupation in the country. The Islamic fundamentalist group has made life harder, especially for women, who are restricted from pursuing higher education, travel, and work.
On a broader scale, the Afghan economy has suffered post-Taliban takeover, with various consequent effects: mass unemployment, a drop in income, malnutrition, and a crumbling healthcare system.
| Rank | Country | Happiness Score Loss (2010–24) | 2024 Happiness Score (out of 10) |
|---|---|---|---|
| 1 | 🇦🇫 Afghanistan | -2.6 | 1.7 |
| 2 | 🇱🇧 Lebanon | -2.3 | 2.7 |
| 3 | 🇯🇴 Jordan | -1.5 | 4.2 |
| 4 | 🇻🇪 Venezuela | -1.3 | 5.6 |
| 5 | 🇲🇼 Malawi | -1.2 | 3.4 |
| 6 | 🇿🇲 Zambia | -1.2 | 3.5 |
| 7 | 🇧🇼 Botswana | -1.2 | 3.4 |
| 8 | 🇾🇪 Yemen | -1.0 | 3.6 |
| 9 | 🇪🇬 Egypt | -1.0 | 4.0 |
| 10 | 🇮🇳 India | -0.9 | 4.1 |
| 11 | 🇧🇩 Bangladesh | -0.9 | 3.9 |
| 12 | 🇨🇩 DRC | -0.7 | 3.3 |
| 13 | 🇹🇳 Tunisia | -0.7 | 4.4 |
| 14 | 🇨🇦 Canada | -0.6 | 6.9 |
| 15 | 🇺🇸 U.S. | -0.6 | 6.7 |
| 16 | 🇨🇴 Colombia | -0.5 | 5.7 |
| 17 | 🇵🇦 Panama | -0.5 | 6.4 |
| 18 | 🇵🇰 Pakistan | -0.5 | 4.7 |
| 19 | 🇿🇼 Zimbabwe | -0.5 | 3.3 |
| 20 | 🇮🇪 Ireland | -0.5 | 6.8 |
| N/A | 🌍 World | +0.1 | 5.5 |
Nine countries in total saw their happiness score drop by a full point or more, on the 0–10 scale.
Noticeably, many of them have seen years of social and economic upheaval. Lebanon, for example, has been grappling with decades of corruption, and a severe liquidity crisis since 2019 that has resulted in a banking system collapse, sending poverty levels skyrocketing.
In Jordan, unprecedented population growth—from refugees leaving Iraq and Syria—has aggravated unemployment rates. A somewhat abrupt change in the line of succession has also raised concerns about political stability in the country.

-

 Markets1 week ago
U.S. Debt Interest Payments Reach $1 Trillion
-

 Business2 weeks ago
Charted: Big Four Market Share by S&P 500 Audits
-

 Markets2 weeks ago
Ranked: The Most Valuable Housing Markets in America
-

 Money2 weeks ago
Which States Have the Highest Minimum Wage in America?
-

 AI2 weeks ago
Ranked: Semiconductor Companies by Industry Revenue Share
-

 Markets2 weeks ago
Ranked: The World’s Top Flight Routes, by Revenue
-

 Demographics2 weeks ago
Population Projections: The World’s 6 Largest Countries in 2075
-

 Markets2 weeks ago
The Top 10 States by Real GDP Growth in 2023