Datastream
Why the Market is Thinking About Bitcoin Differently
The Briefing
- Bitcoin investors are increasingly long-term focused. In 2020, 57% of bitcoin’s (BTC) supply was held onto for more than a year
- Today, nearly 22% of BTC supply is held for more than five years
- Bitcoin hit a $1 trillion market cap milestone in 2021
Why the Market is Thinking About Bitcoin Differently
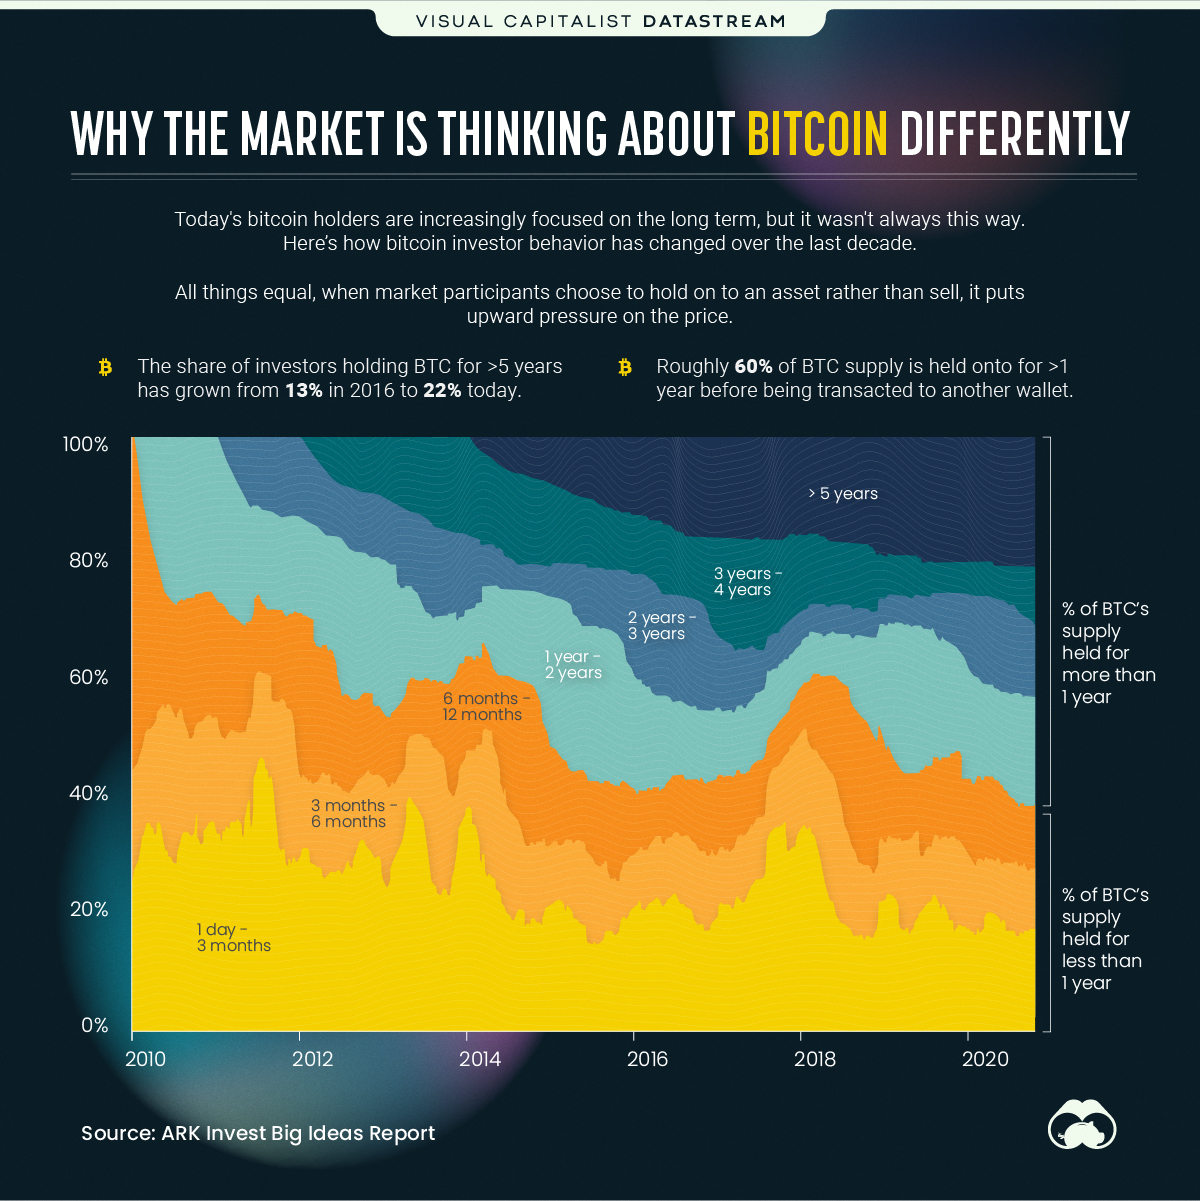
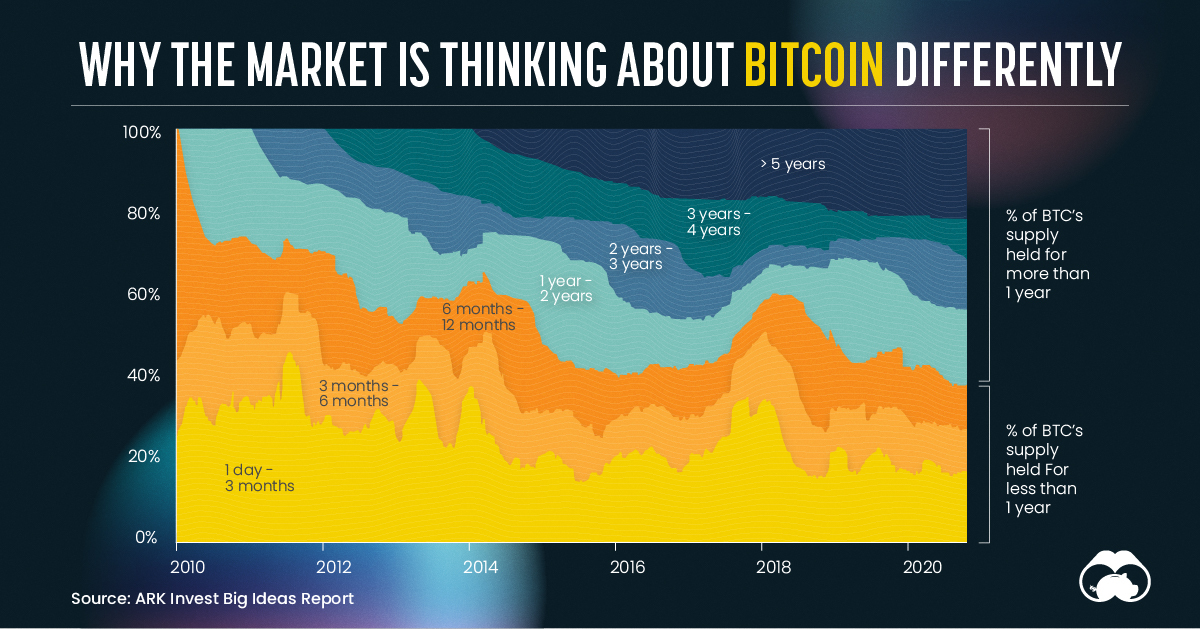
The bull case for bitcoin is linked to the cryptocurrency’s limited supply of only 21 million coins. But scarcity is forming in another way, revolving around investor behavior.
According to research from Ark Invest, investors are holding onto bitcoin for longer and longer durations. By holding the asset rather than selling, it decreases the supply of coins available on the market at any given moment, which can drive up price. This suggests that market participants see the long-term value and potential future payoff the asset possesses.
In the past, durations of days and months were the most common holding periods for bitcoin investors, while holding for more than a year was practically non-existent up until recently.
| BTC Duration Held | % of BTC Supply |
|---|---|
| >5 years | 21.80% |
| 3 to 5 years | 13.38% |
| 2 to 3 years | 10.99% |
| 1 to 2 years | 10.70% |
| 6 months to 1 year | 8.30% |
| 3 months to 6 months | 7.07% |
| 1 day to 3 months | 27.76% |
But days and months have now transitioned towards years.
Near the end of 2020, 57% of bitcoin supply has been held for at least a year. In fact, investors who have held for five years or greater now make up a near 22% of the BTC supply, up from 13% in 2016.
Old School vs. New School
Cryptocurrencies are still a relatively new phenomena. As with many new things that look to upend the status quo, they are often faced with resistance. For much of Bitcoin history, there’s been a tug of war between the old school and the new school of investors.
The more traditional views dismiss its application, and see its price run-up as speculative mania. But it appears the new school train of thought has gained the upper hand in recent times as the cryptocurrnecy demonstrates further signs of entering the mainstream.
1. CEOs begin to show interest
Elon Musk and Jack Dorsey have made sizable bitcoin investments through Tesla and Square, respectively.
2. New ETFs on the block
Multiple Bitcoin ETFs have just been approved as of late by Canadian regulators. For many years the Grayscale Bitcoin Trust (GBTC) was the only readily accessible investment vehicle trading on equity markets that had exposure to BTC.
3. Financial institutions finally joining in?
Mastercard, Visa, and Bank of New York Mellon have made announcements to make it easier for customers to use cryptocurrencies.
The bitcoin price has frequently broken past former thresholds to enter new all-time highs. Recently milestones include BTC briefly skipping past $60,000 in mid-March while also surpassing $1 trillion in total market capitalization.
Where does this data come from?
Source: Ark Invest Big Ideas Report
Notes: This data was released on January 27, 2021


Datastream
Can You Calculate Your Daily Carbon Footprint?
Discover how the average person’s carbon footprint impacts the environment and learn how carbon credits can offset your carbon footprint.


The Briefing
- A person’s carbon footprint is substantial, with activities such as food consumption creating as much as 4,500 g of CO₂ emissions daily.
- By purchasing carbon credits from Carbon Streaming Corporation, you can offset your own emissions and fund positive climate action.
Your Everyday Carbon Footprint
While many large businesses and countries have committed to net-zero goals, it is essential to acknowledge that your everyday activities also contribute to global emissions.
In this graphic, sponsored by Carbon Streaming Corporation, we will explore how the choices we make and the products we use have a profound impact on our carbon footprint.
Carbon Emissions by Activity
Here are some of the daily activities and products of the average person and their carbon footprint, according to Clever Carbon.
| Household Activities & Products | CO2 Emissions (g) |
|---|---|
| 💡 Standard Light Bulb (100 watts, four hours) | 172 g |
| 📱 Mobile Phone Use (195 minutes per day)* | 189 g |
| 👕 Washing Machine (0.63 kWh) | 275 g |
| 🔥 Electric Oven (1.56 kWh) | 675 g |
| ♨️ Tumble Dryer (2.5 kWh) | 1,000 g |
| 🧻 Toilet Roll (2 ply) | 1,300 g |
| 🚿 Hot Shower (10 mins) | 2,000 g |
| 🚙 Daily Commute (one hour, by car) | 3,360 g |
| 🍽️ Average Daily Food Consumption (three meals of 600 calories) | 4,500 g |
| *Phone use based on yearly use of 69kg per the source, Reboxed | |
Your choice of transportation plays a crucial role in determining your carbon footprint. For instance, a 15 km daily commute to work on public transport generates an average of 1,464 g of CO₂ emissions. Compared to 3,360 g—twice the volume for a journey the same length by car.
By opting for more sustainable modes of transport, such as cycling, walking, or public transportation, you can significantly reduce your carbon footprint.
Addressing Your Carbon Footprint
One way to compensate for your emissions is by purchasing high-quality carbon credits.
Carbon credits are used to help fund projects that avoid, reduce or remove CO₂ emissions. This includes nature-based solutions such as reforestation and improved forest management, or technology-based solutions such as the production of biochar and carbon capture and storage (CCS).
While carbon credits offer a potential solution for individuals to help reduce global emissions, public awareness remains a significant challenge. A BCG-Patch survey revealed that only 34% of U.S. consumers are familiar with carbon credits, and only 3% have purchased them in the past.
About Carbon Streaming
By financing the creation or expansion of carbon projects, Carbon Streaming Corporation secures the rights to future carbon credits generated by these sustainable projects. You can then purchase these carbon credits to help fund climate solutions around the world and compensate for your own emissions.
Ready to get involved?
>> Learn more about purchasing carbon credits at Carbon Streaming

-

 Mining1 week ago
Gold vs. S&P 500: Which Has Grown More Over Five Years?
-

 Markets2 weeks ago
Ranked: The Most Valuable Housing Markets in America
-

 Money2 weeks ago
Which States Have the Highest Minimum Wage in America?
-

 AI2 weeks ago
Ranked: Semiconductor Companies by Industry Revenue Share
-

 Markets2 weeks ago
Ranked: The World’s Top Flight Routes, by Revenue
-

 Countries2 weeks ago
Population Projections: The World’s 6 Largest Countries in 2075
-

 Markets2 weeks ago
The Top 10 States by Real GDP Growth in 2023
-

 Demographics2 weeks ago
The Smallest Gender Wage Gaps in OECD Countries