Markets
Why Retail Cannabis Could Be the Next Big Investment Boom
Imagine being an investor in Microsoft at the time of the company’s IPO in 1986. Or better yet, buying Amazon shares while it was still just an aspiring online book store in the late 1990s.
Chances to be an early adopter in the next billion-dollar industry are far and few in between – but it’s exactly what is happening today with the nascent cannabis market. After close to a century of prohibition, cannabis is back in the limelight as legalization rolls across the U.S. and Canada.
Visualizing the Retail Boom
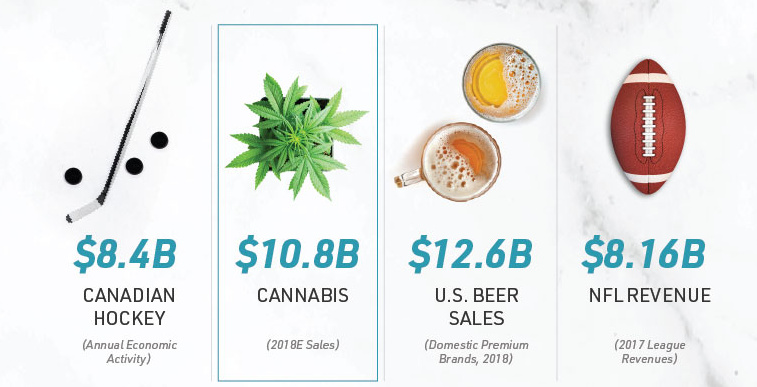
Today’s infographic from Choom Holdings Inc demonstrates the consumer interest in retail cannabis, and the challenges and opportunities that come with this potential.

Legal cannabis today is a lucrative modern market in the U.S. and Canada. In 2018, sales were $10.8 billion – and they are expected to grow to $47.3 billion by 2027.
Who’s driving this growth? A recent survey reveals that:
- 58% of U.S. cannabis consumers use it at least once a week
- 66% of these weekly users are millennials, aged 18 to 34
- 46% of cannabis consumers who also drink, prefer it over alcohol
- 74% of cannabis consumers who also drink, believe it to be safer than alcohol
With more people using cannabis frequently, the disruptive potential of retail cannabis becomes clear.
The Cannabis Supply Issue
Colorado, Washington, Nevada, and most recently California have been among the major U.S. states to legalize recreational cannabis in recent years.
Although cannabis sales across all states have soared, there’s one caveat to mention, which is clearly seen in the case of California. As the state began selling cannabis in stores on January 1st, it also simultaneously ran out of supply when the grey market came rushing up.
This trend of pent-up demand is clear across both mature and new markets – even Canada couldn’t escape the same supply crunch, subjecting customers to long lines and wait times on day one of legalization. For example, only one legal retail store was open in the entire province of British Columbia on October 17th.
It’s not surprising to see why cannabis is such a valuable retail product, though: dispensaries typically outsell Whole Foods and other similar retailers.
[table “405” not found /]
(Source: Marijuana Business Daily)
The Value Play in Cannabis
Seizing an early adoption opportunity is a best-case scenario in the investing world.
Today, such an opportunity may come in the form of retail cannabis. The segment still faces specific hurdles, but these challenges have the potential to convert into golden opportunities as the market matures in North America:
1. Inherited demand
Legal retailers will reach new consumers as the grey market begins to come online.
2. Strong foundation
Retail cannabis is only legal in ten U.S. states, but it already shows strong promise.
3. Building bridges
Retail cannabis stores are just now opening in Canada, but licenses are hard to get.
Retail cannabis is a brave new world for consumers and investors alike – and early entrants to the industry with access to capital and a large retail footprint will likely lead the charge.


Markets
U.S. Debt Interest Payments Reach $1 Trillion
U.S. debt interest payments have surged past the $1 trillion dollar mark, amid high interest rates and an ever-expanding debt burden.


U.S. Debt Interest Payments Reach $1 Trillion
This was originally posted on our Voronoi app. Download the app for free on iOS or Android and discover incredible data-driven charts from a variety of trusted sources.
The cost of paying for America’s national debt crossed the $1 trillion dollar mark in 2023, driven by high interest rates and a record $34 trillion mountain of debt.
Over the last decade, U.S. debt interest payments have more than doubled amid vast government spending during the pandemic crisis. As debt payments continue to soar, the Congressional Budget Office (CBO) reported that debt servicing costs surpassed defense spending for the first time ever this year.
This graphic shows the sharp rise in U.S. debt payments, based on data from the Federal Reserve.
A $1 Trillion Interest Bill, and Growing
Below, we show how U.S. debt interest payments have risen at a faster pace than at another time in modern history:
| Date | Interest Payments | U.S. National Debt |
|---|---|---|
| 2023 | $1.0T | $34.0T |
| 2022 | $830B | $31.4T |
| 2021 | $612B | $29.6T |
| 2020 | $518B | $27.7T |
| 2019 | $564B | $23.2T |
| 2018 | $571B | $22.0T |
| 2017 | $493B | $20.5T |
| 2016 | $460B | $20.0T |
| 2015 | $435B | $18.9T |
| 2014 | $442B | $18.1T |
| 2013 | $425B | $17.2T |
| 2012 | $417B | $16.4T |
| 2011 | $433B | $15.2T |
| 2010 | $400B | $14.0T |
| 2009 | $354B | $12.3T |
| 2008 | $380B | $10.7T |
| 2007 | $414B | $9.2T |
| 2006 | $387B | $8.7T |
| 2005 | $355B | $8.2T |
| 2004 | $318B | $7.6T |
| 2003 | $294B | $7.0T |
| 2002 | $298B | $6.4T |
| 2001 | $318B | $5.9T |
| 2000 | $353B | $5.7T |
| 1999 | $353B | $5.8T |
| 1998 | $360B | $5.6T |
| 1997 | $368B | $5.5T |
| 1996 | $362B | $5.3T |
| 1995 | $357B | $5.0T |
| 1994 | $334B | $4.8T |
| 1993 | $311B | $4.5T |
| 1992 | $306B | $4.2T |
| 1991 | $308B | $3.8T |
| 1990 | $298B | $3.4T |
| 1989 | $275B | $3.0T |
| 1988 | $254B | $2.7T |
| 1987 | $240B | $2.4T |
| 1986 | $225B | $2.2T |
| 1985 | $219B | $1.9T |
| 1984 | $205B | $1.7T |
| 1983 | $176B | $1.4T |
| 1982 | $157B | $1.2T |
| 1981 | $142B | $1.0T |
| 1980 | $113B | $930.2B |
| 1979 | $96B | $845.1B |
| 1978 | $84B | $789.2B |
| 1977 | $69B | $718.9B |
| 1976 | $61B | $653.5B |
| 1975 | $55B | $576.6B |
| 1974 | $50B | $492.7B |
| 1973 | $45B | $469.1B |
| 1972 | $39B | $448.5B |
| 1971 | $36B | $424.1B |
| 1970 | $35B | $389.2B |
| 1969 | $30B | $368.2B |
| 1968 | $25B | $358.0B |
| 1967 | $23B | $344.7B |
| 1966 | $21B | $329.3B |
Interest payments represent seasonally adjusted annual rate at the end of Q4.
At current rates, the U.S. national debt is growing by a remarkable $1 trillion about every 100 days, equal to roughly $3.6 trillion per year.
As the national debt has ballooned, debt payments even exceeded Medicaid outlays in 2023—one of the government’s largest expenditures. On average, the U.S. spent more than $2 billion per day on interest costs last year. Going further, the U.S. government is projected to spend a historic $12.4 trillion on interest payments over the next decade, averaging about $37,100 per American.
Exacerbating matters is that the U.S. is running a steep deficit, which stood at $1.1 trillion for the first six months of fiscal 2024. This has accelerated due to the 43% increase in debt servicing costs along with a $31 billion dollar increase in defense spending from a year earlier. Additionally, a $30 billion increase in funding for the Federal Deposit Insurance Corporation in light of the regional banking crisis last year was a major contributor to the deficit increase.
Overall, the CBO forecasts that roughly 75% of the federal deficit’s increase will be due to interest costs by 2034.

-

 Maps2 weeks ago
Mapped: Average Wages Across Europe
-

 Money1 week ago
Which States Have the Highest Minimum Wage in America?
-

 Real Estate1 week ago
Ranked: The Most Valuable Housing Markets in America
-

 Markets1 week ago
Charted: Big Four Market Share by S&P 500 Audits
-

 AI1 week ago
The Stock Performance of U.S. Chipmakers So Far in 2024
-

 Automotive1 week ago
Almost Every EV Stock is Down After Q1 2024
-

 Money2 weeks ago
Where Does One U.S. Tax Dollar Go?
-

 Green2 weeks ago
Ranked: Top Countries by Total Forest Loss Since 2001