Markets
Why Investors Tuned Out Netflix
Why Investors Tuned Out Netflix
Netflix shares have enjoyed an incredible run over the past decade. Subscriber growth seemed limitless, profitability was improving, and the pandemic gave us a compelling case for watching TV at home.
Things took a drastic turn on April 19, 2022, when Netflix announced its Q1 results. Rather than gaining subscribers as forecasted, the company lost 200,000. This was the first decline in over a decade, and investors rushed to pull their money out.
So, is there a buying opportunity now that Netflix shares are trading at multi-year lows? To help you decide, we’ve provided further context around this historic crash.
Netflix Shares Fall Flat
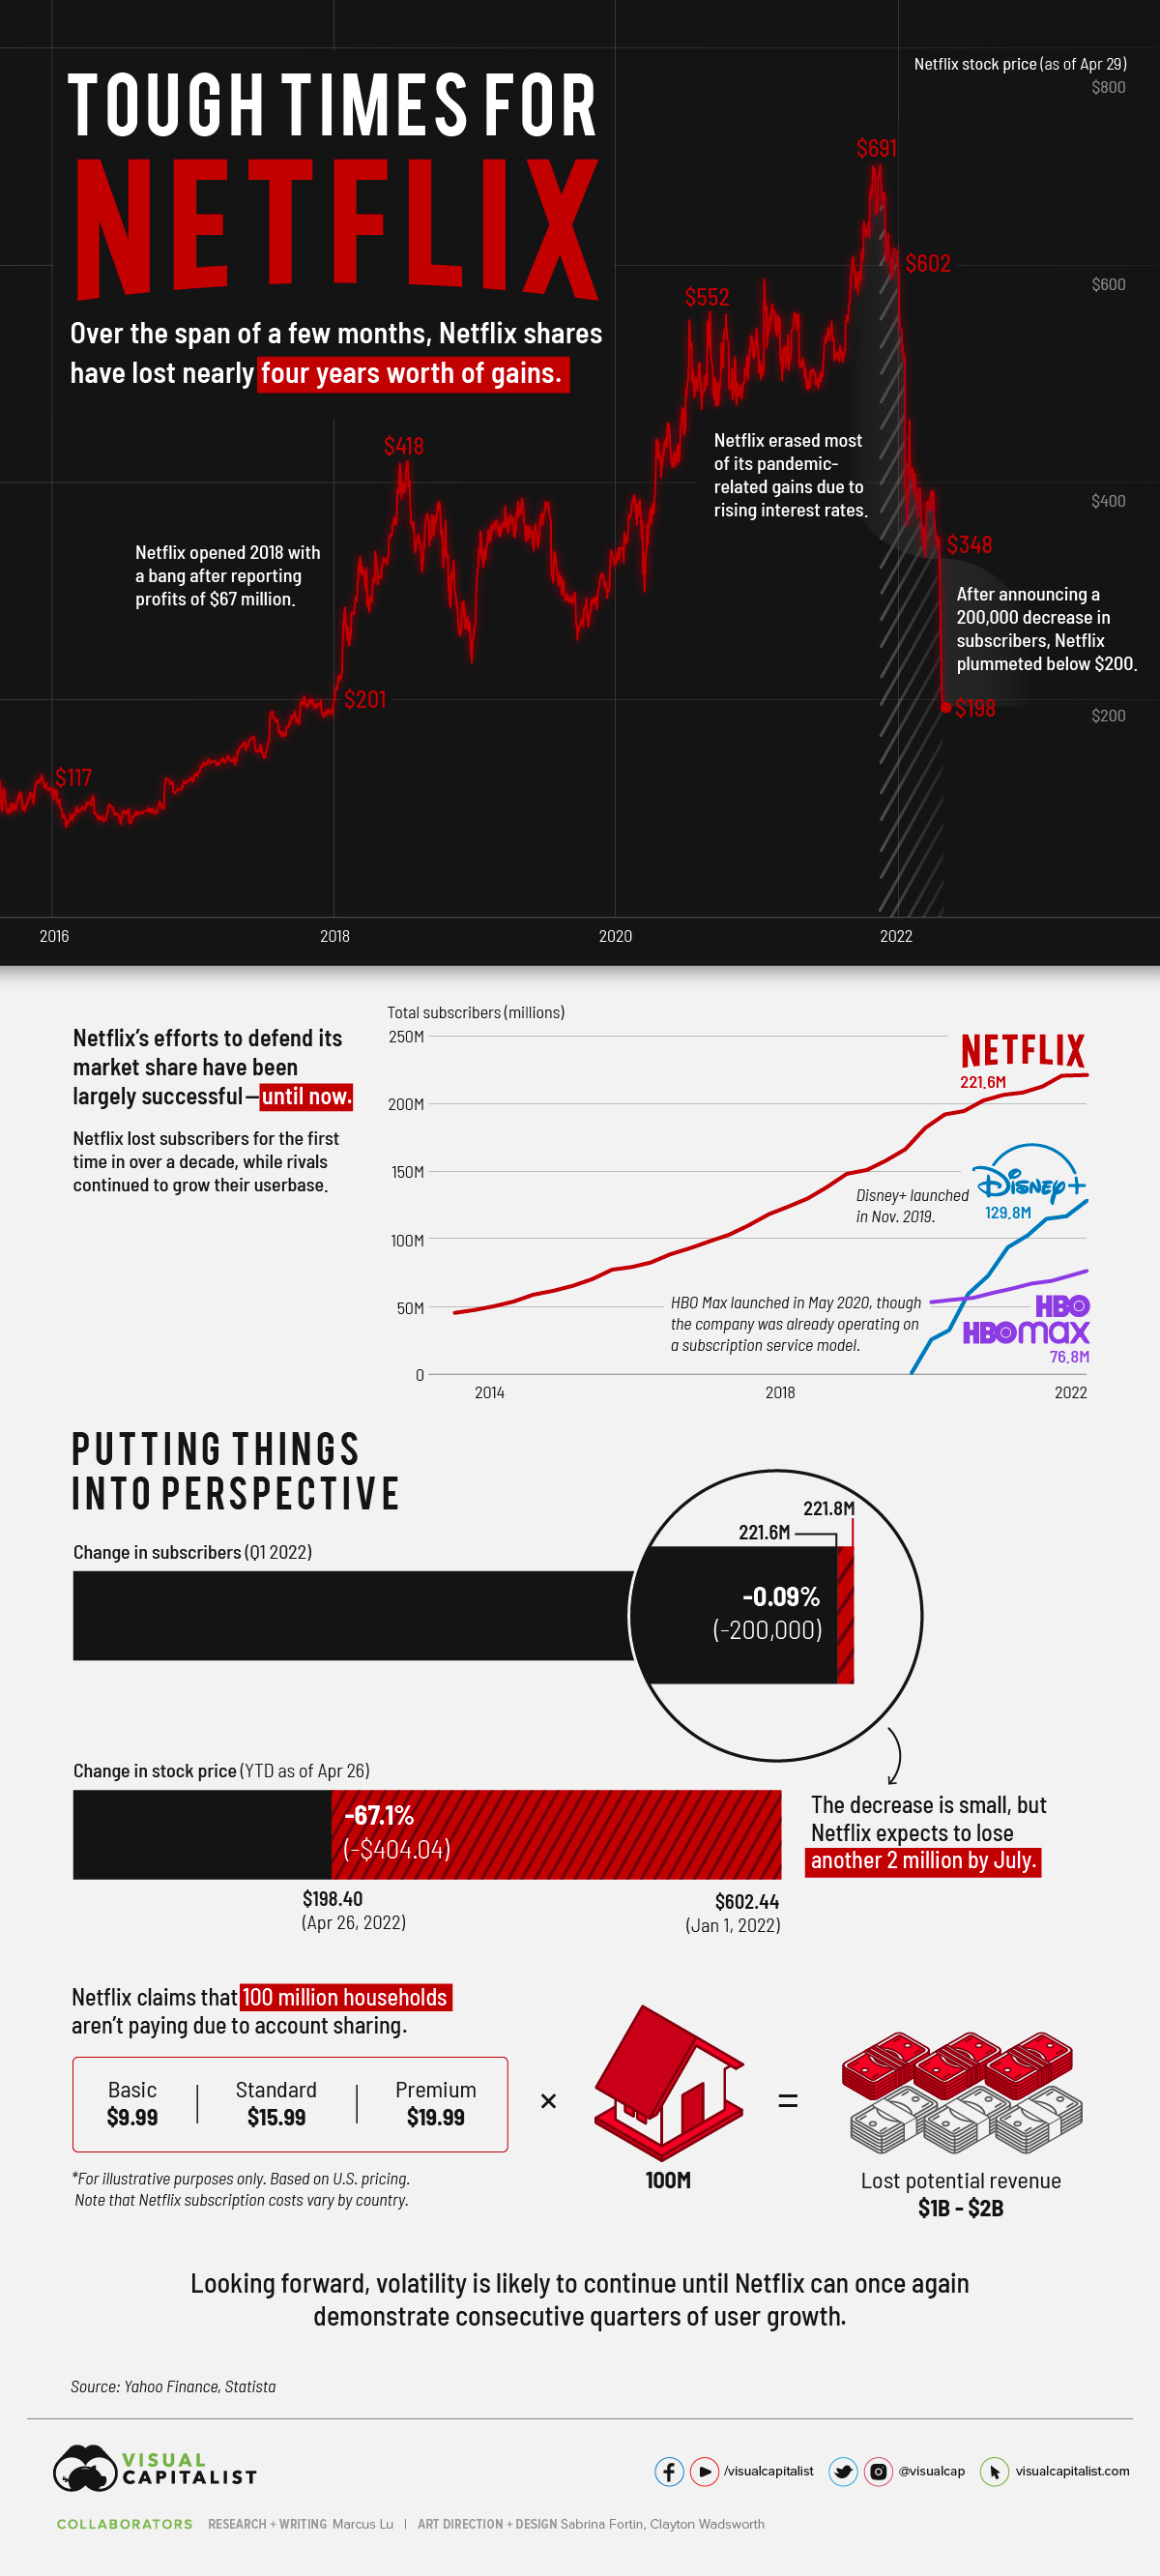
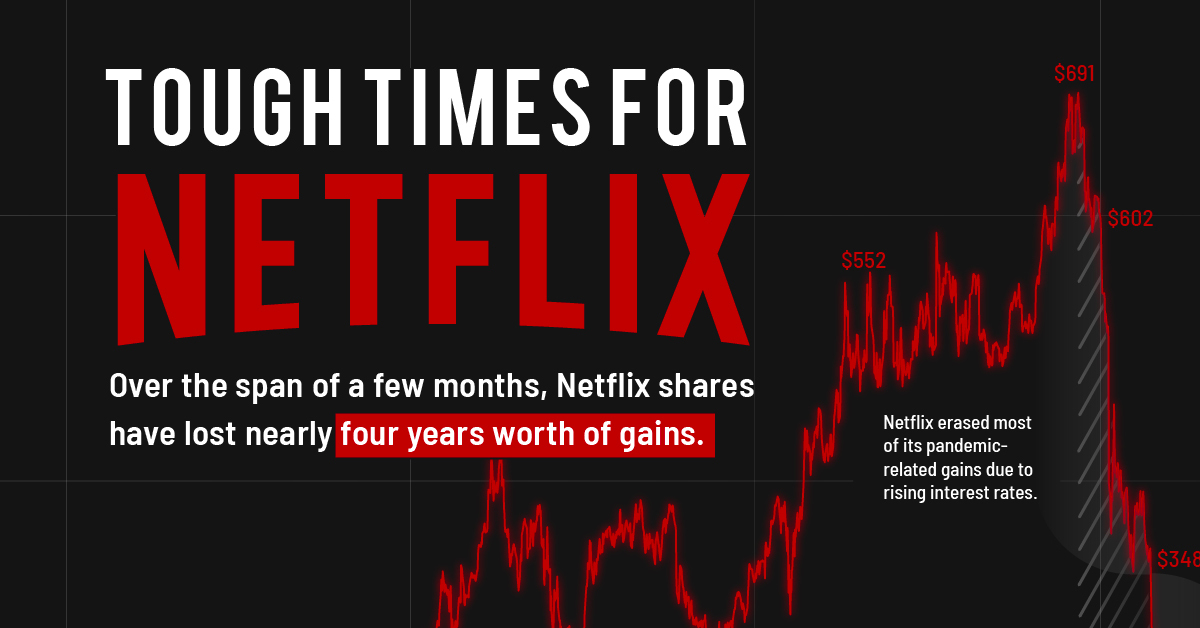
Over the span of a few months, Netflix shares have erased roughly four years worth of gains. Not all of these losses are due to the drop in subscribers, however.
Prior to the Q1 earnings announcement, Netflix had lost most of its pandemic-related gains. This was primarily due to rising interest rates and people spending less time at home. Still, analysts expected Netflix to add 2.7 million subscribers.
After announcing it had lost 200,000 subscribers instead, the stock quickly fell below $200 (the first time since late 2017). YTD performance (as of April 29, 2022) is an abysmal -67%.
What’s to Blame?
Netflix pointed to three culprits for its loss in subscribers:
- The suspension of its services in Russia
- Increasing competition
- Account sharing
Let’s focus on the latter two, starting with competition. The following table compares the number of subscribers between Netflix and two prominent rivals: Disney+ and HBO.
| Date | Netflix Subscribers | Disney+ Subscribers | HBO & HBO Max Subscribers |
|---|---|---|---|
| Q1 2020 | 182.8M | 26.5M | 53.8M |
| Q2 2020 | 192.9M | 33.5M | 55.5M |
| Q3 2020 | 195.1M | 60.5M | 56.9M |
| Q4 2020 | 203.6M | 73.7M | 60.6M |
| Q1 2021 | 207.6M | 94.9M | 63.9M |
| Q2 2021 | 209.2M | 103.6M | 67.5M |
| Q3 2021 | 213.6M | 116.0M | 69.4M |
| Q4 2021 | 221.8M | 118.1M | 73.8M |
| Q1 2022 | 221.6M | 129.8M | 76.8M |
Disney+ was launched in November 2019, while HBO Max was launched in May 2020. HBO (the channel) and HBO Max subscribers are rolled up as one.
Based on this data, Netflix may be starting to feel the heat of competition. A loss in subscribers is bad news, but it’s even worse when competitors report growth over the same time period.
Keep in mind that we’re only talking about a single quarter, and not a long-term trend. It’s too early to say whether Netflix is actually losing ground, though the company has warned it could shed another 2 million subscribers by July.
Next is account sharing, which according to Netflix, amounts to 100 million non-paying households. This is spread out across the entire world, but if we use the company’s U.S. pricing as a benchmark, it translates to between $1 to $2 billion in lost revenue.
Growth is Everything
In the tech sector, growth is everything. If Netflix can’t return to posting consecutive quarters of subscriber growth, it could be many years before the stock returns to its previous high.
“We’ve definitely seen that once you get to 70, 80 millions of subs, things really tend to slow down. We saw it with HBO, and we’ve seen the same issues with Disney. They’re hitting the upper limit on the big growth.”
– David Campo, NYU
Regaining that momentum is going to be difficult, but Netflix does have plans. To address password sharing, the service may charge a fee for out-of-household profiles that are added to an account. The specifics around enforcement are vague, but Netflix is also considering a lower-priced subscription plan that includes advertising.
Only time will tell if these strategies can stop the bleeding, or perhaps even boost profitability. Rampant inflation, which might persuade consumers to cut down on their subscriptions, could be a source of additional headwinds.


Markets
U.S. Debt Interest Payments Reach $1 Trillion
U.S. debt interest payments have surged past the $1 trillion dollar mark, amid high interest rates and an ever-expanding debt burden.


U.S. Debt Interest Payments Reach $1 Trillion
This was originally posted on our Voronoi app. Download the app for free on iOS or Android and discover incredible data-driven charts from a variety of trusted sources.
The cost of paying for America’s national debt crossed the $1 trillion dollar mark in 2023, driven by high interest rates and a record $34 trillion mountain of debt.
Over the last decade, U.S. debt interest payments have more than doubled amid vast government spending during the pandemic crisis. As debt payments continue to soar, the Congressional Budget Office (CBO) reported that debt servicing costs surpassed defense spending for the first time ever this year.
This graphic shows the sharp rise in U.S. debt payments, based on data from the Federal Reserve.
A $1 Trillion Interest Bill, and Growing
Below, we show how U.S. debt interest payments have risen at a faster pace than at another time in modern history:
| Date | Interest Payments | U.S. National Debt |
|---|---|---|
| 2023 | $1.0T | $34.0T |
| 2022 | $830B | $31.4T |
| 2021 | $612B | $29.6T |
| 2020 | $518B | $27.7T |
| 2019 | $564B | $23.2T |
| 2018 | $571B | $22.0T |
| 2017 | $493B | $20.5T |
| 2016 | $460B | $20.0T |
| 2015 | $435B | $18.9T |
| 2014 | $442B | $18.1T |
| 2013 | $425B | $17.2T |
| 2012 | $417B | $16.4T |
| 2011 | $433B | $15.2T |
| 2010 | $400B | $14.0T |
| 2009 | $354B | $12.3T |
| 2008 | $380B | $10.7T |
| 2007 | $414B | $9.2T |
| 2006 | $387B | $8.7T |
| 2005 | $355B | $8.2T |
| 2004 | $318B | $7.6T |
| 2003 | $294B | $7.0T |
| 2002 | $298B | $6.4T |
| 2001 | $318B | $5.9T |
| 2000 | $353B | $5.7T |
| 1999 | $353B | $5.8T |
| 1998 | $360B | $5.6T |
| 1997 | $368B | $5.5T |
| 1996 | $362B | $5.3T |
| 1995 | $357B | $5.0T |
| 1994 | $334B | $4.8T |
| 1993 | $311B | $4.5T |
| 1992 | $306B | $4.2T |
| 1991 | $308B | $3.8T |
| 1990 | $298B | $3.4T |
| 1989 | $275B | $3.0T |
| 1988 | $254B | $2.7T |
| 1987 | $240B | $2.4T |
| 1986 | $225B | $2.2T |
| 1985 | $219B | $1.9T |
| 1984 | $205B | $1.7T |
| 1983 | $176B | $1.4T |
| 1982 | $157B | $1.2T |
| 1981 | $142B | $1.0T |
| 1980 | $113B | $930.2B |
| 1979 | $96B | $845.1B |
| 1978 | $84B | $789.2B |
| 1977 | $69B | $718.9B |
| 1976 | $61B | $653.5B |
| 1975 | $55B | $576.6B |
| 1974 | $50B | $492.7B |
| 1973 | $45B | $469.1B |
| 1972 | $39B | $448.5B |
| 1971 | $36B | $424.1B |
| 1970 | $35B | $389.2B |
| 1969 | $30B | $368.2B |
| 1968 | $25B | $358.0B |
| 1967 | $23B | $344.7B |
| 1966 | $21B | $329.3B |
Interest payments represent seasonally adjusted annual rate at the end of Q4.
At current rates, the U.S. national debt is growing by a remarkable $1 trillion about every 100 days, equal to roughly $3.6 trillion per year.
As the national debt has ballooned, debt payments even exceeded Medicaid outlays in 2023—one of the government’s largest expenditures. On average, the U.S. spent more than $2 billion per day on interest costs last year. Going further, the U.S. government is projected to spend a historic $12.4 trillion on interest payments over the next decade, averaging about $37,100 per American.
Exacerbating matters is that the U.S. is running a steep deficit, which stood at $1.1 trillion for the first six months of fiscal 2024. This has accelerated due to the 43% increase in debt servicing costs along with a $31 billion dollar increase in defense spending from a year earlier. Additionally, a $30 billion increase in funding for the Federal Deposit Insurance Corporation in light of the regional banking crisis last year was a major contributor to the deficit increase.
Overall, the CBO forecasts that roughly 75% of the federal deficit’s increase will be due to interest costs by 2034.

-

 Real Estate2 weeks ago
Visualizing America’s Shortage of Affordable Homes
-

 Technology1 week ago
Ranked: Semiconductor Companies by Industry Revenue Share
-

 Money1 week ago
Which States Have the Highest Minimum Wage in America?
-

 Real Estate1 week ago
Ranked: The Most Valuable Housing Markets in America
-

 Business1 week ago
Charted: Big Four Market Share by S&P 500 Audits
-

 AI2 weeks ago
The Stock Performance of U.S. Chipmakers So Far in 2024
-

 Misc2 weeks ago
Almost Every EV Stock is Down After Q1 2024
-

 Money2 weeks ago
Where Does One U.S. Tax Dollar Go?