Energy
Who’s Still Buying Fossil Fuels From Russia?
![]() Subscribe to the Elements free mailing list for more like this
Subscribe to the Elements free mailing list for more like this
The Largest Importers of Russian Fossil Fuels Since the War
This was originally posted on Elements. Sign up to the free mailing list to get beautiful visualizations on natural resource megatrends in your email every week.
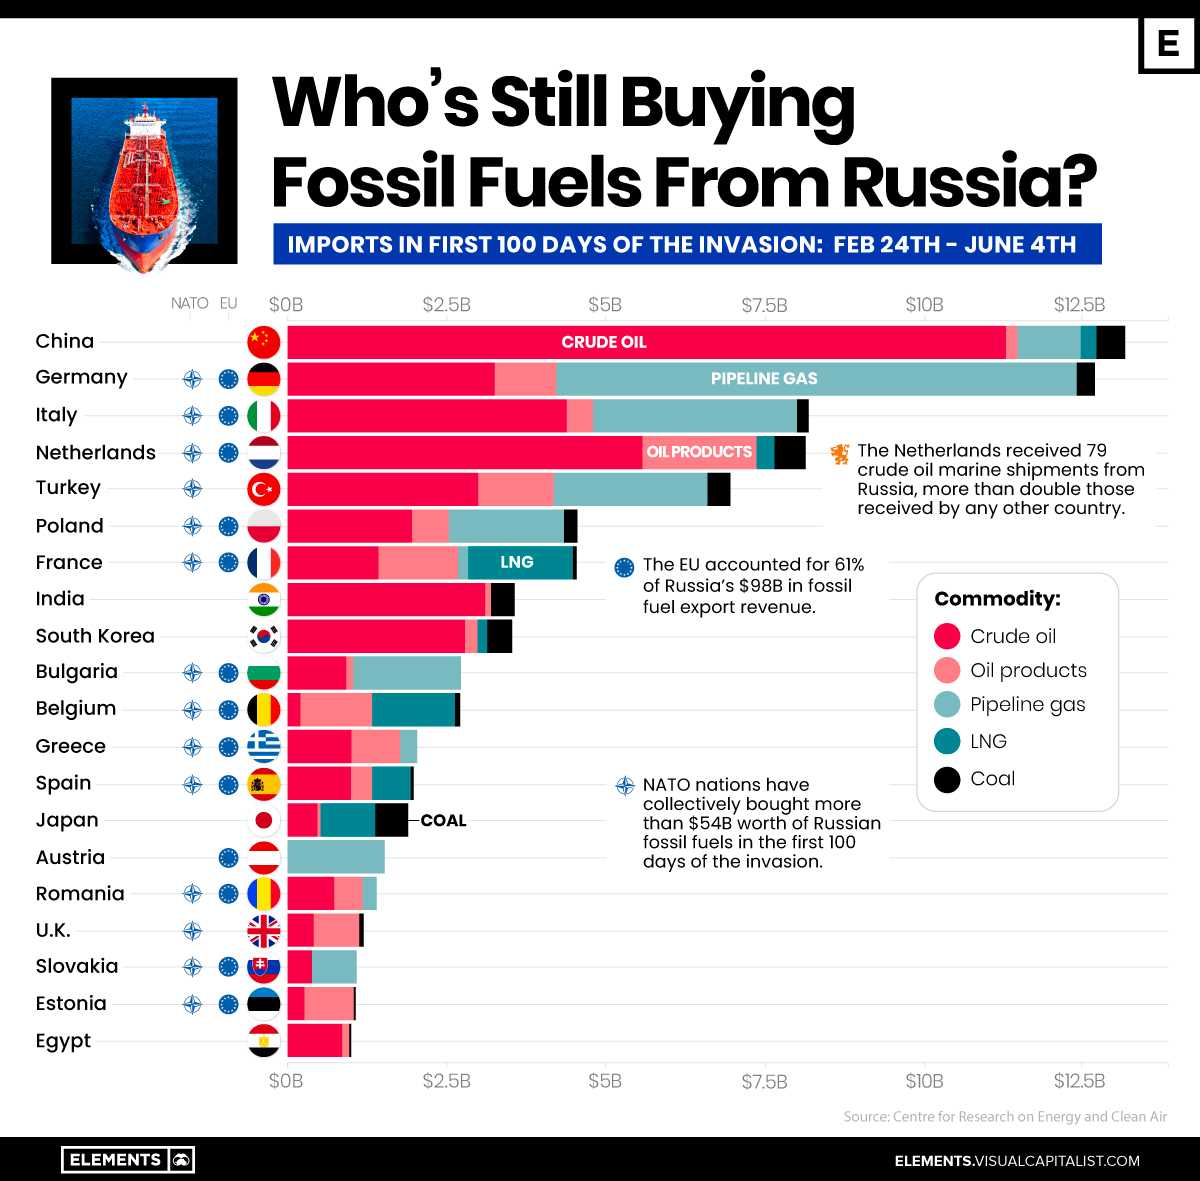
Despite looming sanctions and import bans, Russia exported $97.7 billion worth of fossil fuels in the first 100 days since its invasion of Ukraine, at an average of $977 million per day.
So, which fossil fuels are being exported by Russia, and who is importing these fuels?
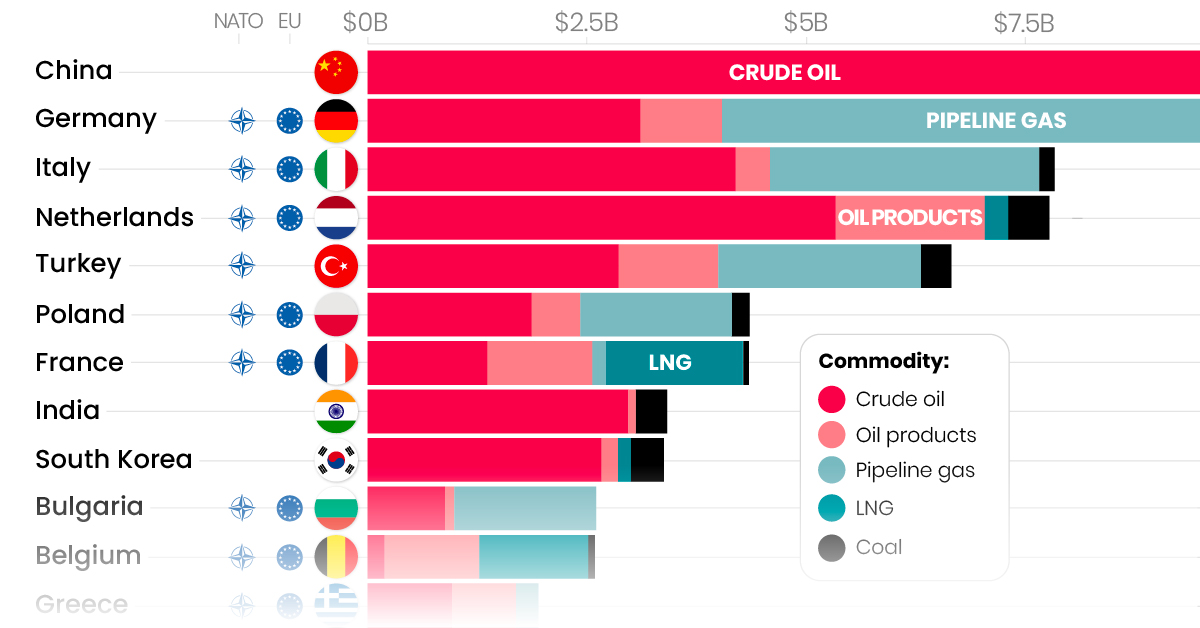
The above infographic tracks the biggest importers of Russia’s fossil fuel exports during the first 100 days of the war based on data from the Centre for Research on Energy and Clean Air (CREA).
In Demand: Russia’s Black Gold
The global energy market has seen several cyclical shocks over the last few years.
The gradual decline in upstream oil and gas investment followed by pandemic-induced production cuts led to a drop in supply, while people consumed more energy as economies reopened and winters got colder. Consequently, fossil fuel demand was rising even before Russia’s invasion of Ukraine, which exacerbated the market shock.
Russia is the third-largest producer and second-largest exporter of crude oil. In the 100 days since the invasion, oil was by far Russia’s most valuable fossil fuel export, accounting for $48 billion or roughly half of the total export revenue.
| Fossil fuel | Revenue from exports (Feb 24 - June 4) | % of total Russian fossil fuel export revenue |
|---|---|---|
| Crude oil | $48.3B | 49.4% |
| Pipeline gas | $25.2B | 25.8% |
| Oil products | $13.6B | 13.9% |
| Liquified Natural Gas (LNG) | $5.4B | 5.5% |
| Coal | $5.0B | 5.1% |
| Total | $97.7B | 100% |
While Russian crude oil is shipped on tankers, a network of pipelines transports Russian gas to Europe. In fact, Russia accounts for 41% of all natural gas imports to the EU, and some countries are almost exclusively dependent on Russian gas. Of the $25 billion exported in pipeline gas, 85% went to the EU.
The Top Importers of Russian Fossil Fuels
The EU bloc accounted for 61% of Russia’s fossil fuel export revenue during the 100-day period.
Germany, Italy, and the Netherlands—members of both the EU and NATO—were among the largest importers, with only China surpassing them.
| Country | Value of fossil fuel imports from Russia (Feb 24 - Jun 4) | % of Russian fossil fuel export revenue |
|---|---|---|
| 🇨🇳 China | $13.2B | 13.5% |
| 🇩🇪 Germany | $12.7B | 12.9% |
| 🇮🇹 Italy | $8.2B | 8.4% |
| 🇳🇱 Netherlands | $8.2B | 8.4% |
| 🇹🇷 Turkey | $7.0B | 7.2% |
| 🇵🇱 Poland | $4.6B | 4.7% |
| 🇫🇷 France | $4.5B | 4.6% |
| 🇮🇳 India | $3.6B | 3.7% |
| 🌍 Other | $35.7B | 36.5% |
| Total | $97.7B | 100% |
China overtook Germany as the largest importer, importing nearly 2 million barrels of discounted Russian oil per day in May—up 55% relative to a year ago. Similarly, Russia surpassed Saudi Arabia as China’s largest oil supplier.
The biggest increase in imports came from India, buying 18% of all Russian oil exports during the 100-day period. A significant amount of the oil that goes to India is re-exported as refined products to the U.S. and Europe, which are trying to become independent of Russian imports.
Reducing Reliance on Russia
In response to the invasion of Ukraine, several countries have taken strict action against Russia through sanctions on exports, including fossil fuels.
The U.S. and Sweden have banned Russian fossil fuel imports entirely, with monthly import volumes down 100% and 99% in May relative to when the invasion began, respectively.
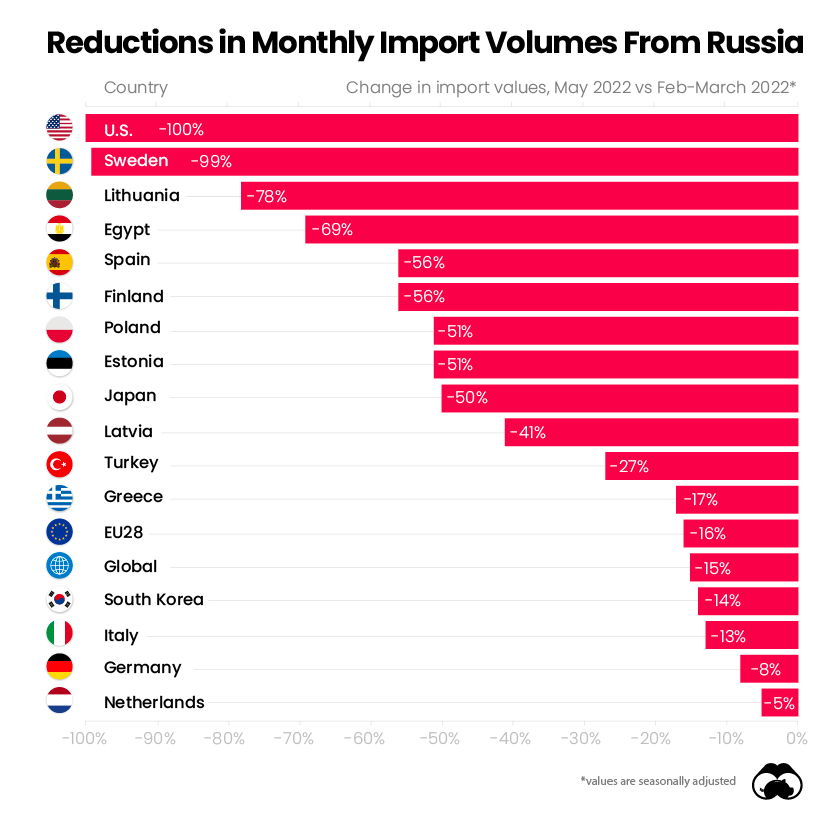
On a global scale, monthly fossil fuel import volumes from Russia were down 15% in May, an indication of the negative political sentiment surrounding the country.
It’s also worth noting that several European countries, including some of the largest importers over the 100-day period, have cut back on Russian fossil fuels. Besides the EU’s collective decision to reduce dependence on Russia, some countries have also refused the country’s ruble payment scheme, leading to a drop in imports.
The import curtailment is likely to continue. The EU recently adopted a sixth sanction package against Russia, placing a complete ban on all Russian seaborne crude oil products. The ban, which covers 90% of the EU’s oil imports from Russia, will likely realize its full impact after a six-to-eight month period that permits the execution of existing contracts.
While the EU is phasing out Russian oil, several European countries are heavily reliant on Russian gas. A full-fledged boycott on Russia’s fossil fuels would also hurt the European economy—therefore, the phase-out will likely be gradual, and subject to the changing geopolitical environment.


Energy
The World’s Biggest Nuclear Energy Producers
China has grown its nuclear capacity over the last decade, now ranking second on the list of top nuclear energy producers.


The World’s Biggest Nuclear Energy Producers
This was originally posted on our Voronoi app. Download the app for free on Apple or Android and discover incredible data-driven charts from a variety of trusted sources.
Scientists in South Korea recently broke a record in a nuclear fusion experiment. For 48 seconds, they sustained a temperature seven times that of the sun’s core.
But generating commercially viable energy from nuclear fusion still remains more science fiction than reality. Meanwhile, its more reliable sibling, nuclear fission, has been powering our world for many decades.
In this graphic, we visualized the top producers of nuclear energy by their share of the global total, measured in terawatt hours (TWh). Data for this was sourced from the Nuclear Energy Institute, last updated in August 2022.
Which Country Generates the Most Nuclear Energy?
Nuclear energy production in the U.S. is more than twice the amount produced by China (ranked second) and France (ranked third) put together. In total, the U.S. accounts for nearly 30% of global nuclear energy output.
However, nuclear power only accounts for one-fifth of America’s electricity supply. This is in contrast to France, which generates 60% of its electricity from nuclear plants.
| Rank | Country | Nuclear Energy Produced (TWh) | % of Total |
|---|---|---|---|
| 1 | 🇺🇸 U.S. | 772 | 29% |
| 2 | 🇨🇳 China | 383 | 14% |
| 3 | 🇫🇷 France | 363 | 14% |
| 4 | 🇷🇺 Russia | 208 | 8% |
| 5 | 🇰🇷 South Korea | 150 | 6% |
| 6 | 🇨🇦 Canada | 87 | 3% |
| 7 | 🇺🇦 Ukraine | 81 | 3% |
| 8 | 🇩🇪 Germany | 65 | 2% |
| 9 | 🇯🇵 Japan | 61 | 2% |
| 10 | 🇪🇸 Spain | 54 | 2% |
| 11 | 🇸🇪 Sweden | 51 | 2% |
| 12 | 🇧🇪 Belgium | 48 | 2% |
| 13 | 🇬🇧 UK | 42 | 2% |
| 14 | 🇮🇳 India | 40 | 2% |
| 15 | 🇨🇿 Czech Republic | 29 | 1% |
| N/A | 🌐 Other | 219 | 8% |
| N/A | 🌍 Total | 2,653 | 100% |
Another highlight is how China has rapidly grown its nuclear energy capabilities in the last decade. Between 2016 and 2021, for example, it increased its share of global nuclear energy output from less than 10% to more than 14%, overtaking France for second place.
On the opposite end, the UK’s share has slipped to 2% over the same time period.
Meanwhile, Ukraine has heavily relied on nuclear energy to power its grid. In March 2022, it lost access to its key Zaporizhzhia Nuclear Power Station after Russian forces wrested control of the facility. With six 1,000 MW reactors, the plant is one of the largest in Europe. It is currently not producing any power, and has been the site of recent drone attacks.

-

 Mining2 weeks ago
Charted: The Value Gap Between the Gold Price and Gold Miners
-

 Real Estate1 week ago
Ranked: The Most Valuable Housing Markets in America
-

 Business1 week ago
Charted: Big Four Market Share by S&P 500 Audits
-

 AI1 week ago
The Stock Performance of U.S. Chipmakers So Far in 2024
-

 Misc1 week ago
Almost Every EV Stock is Down After Q1 2024
-

 Money2 weeks ago
Where Does One U.S. Tax Dollar Go?
-

 Green2 weeks ago
Ranked: Top Countries by Total Forest Loss Since 2001
-

 Real Estate2 weeks ago
Visualizing America’s Shortage of Affordable Homes