Misc
Visualized: Who Americans Spend Their Time With


Who Americans Spend Their Time With
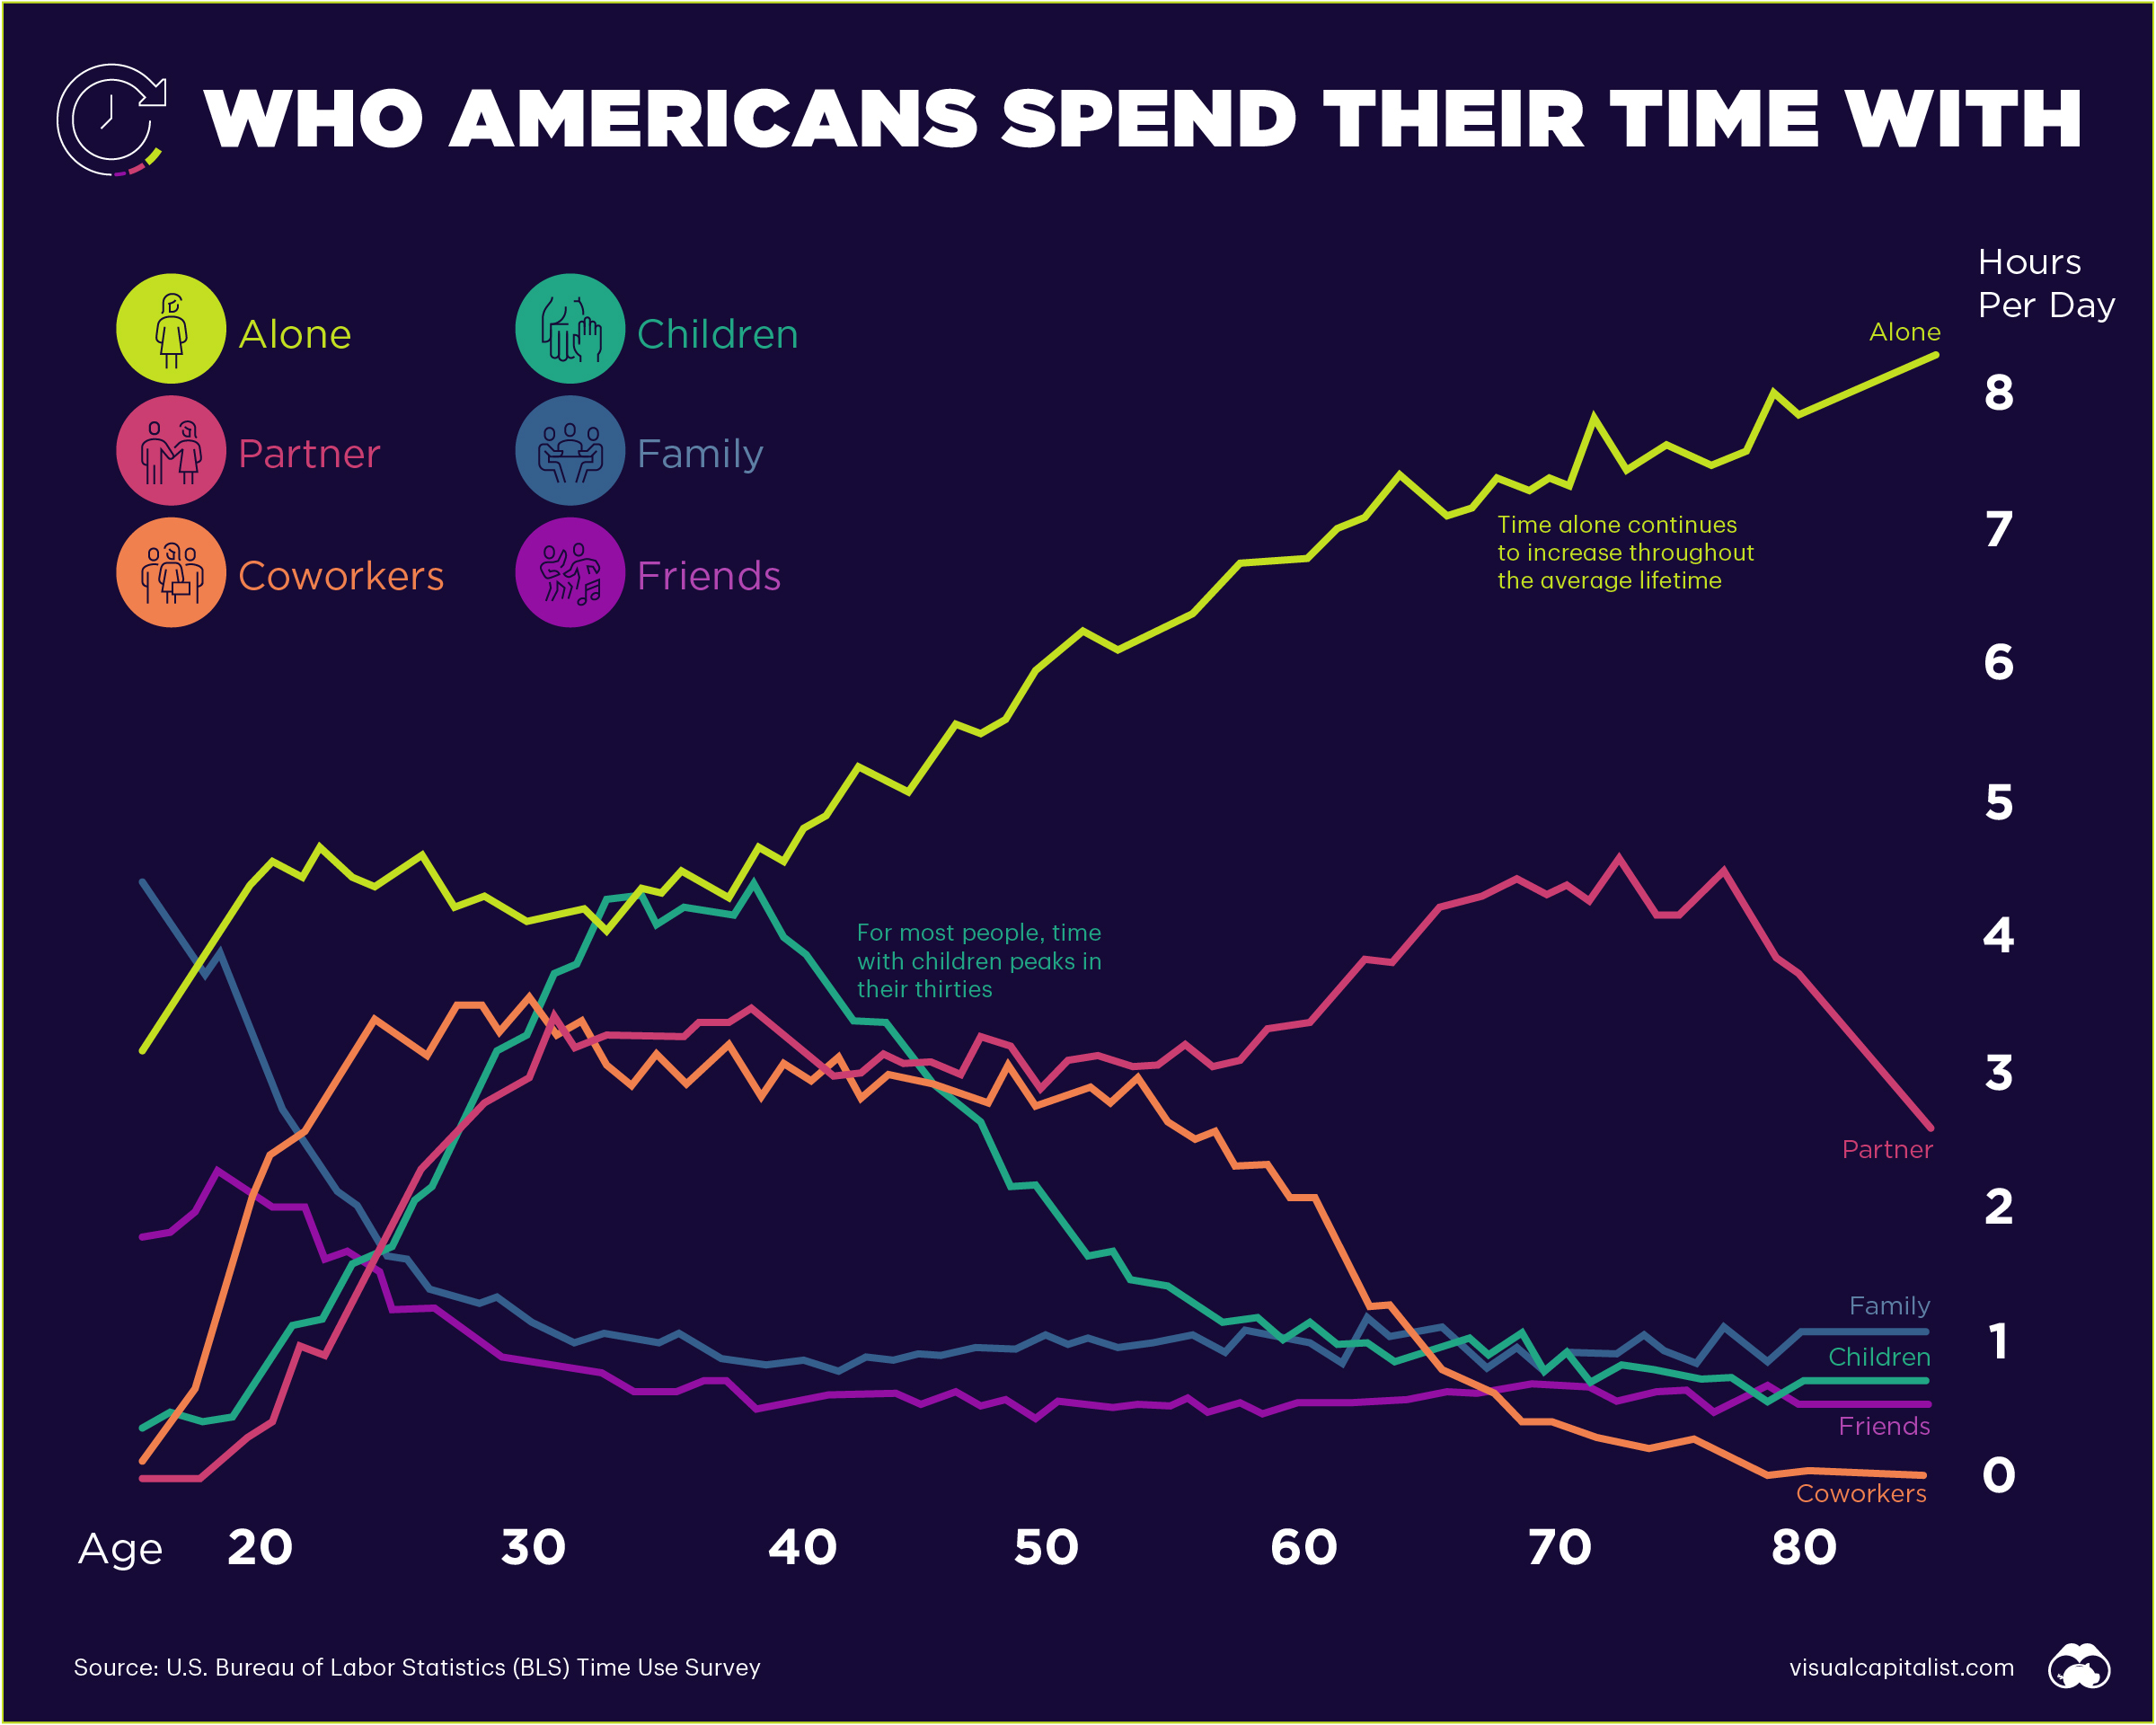
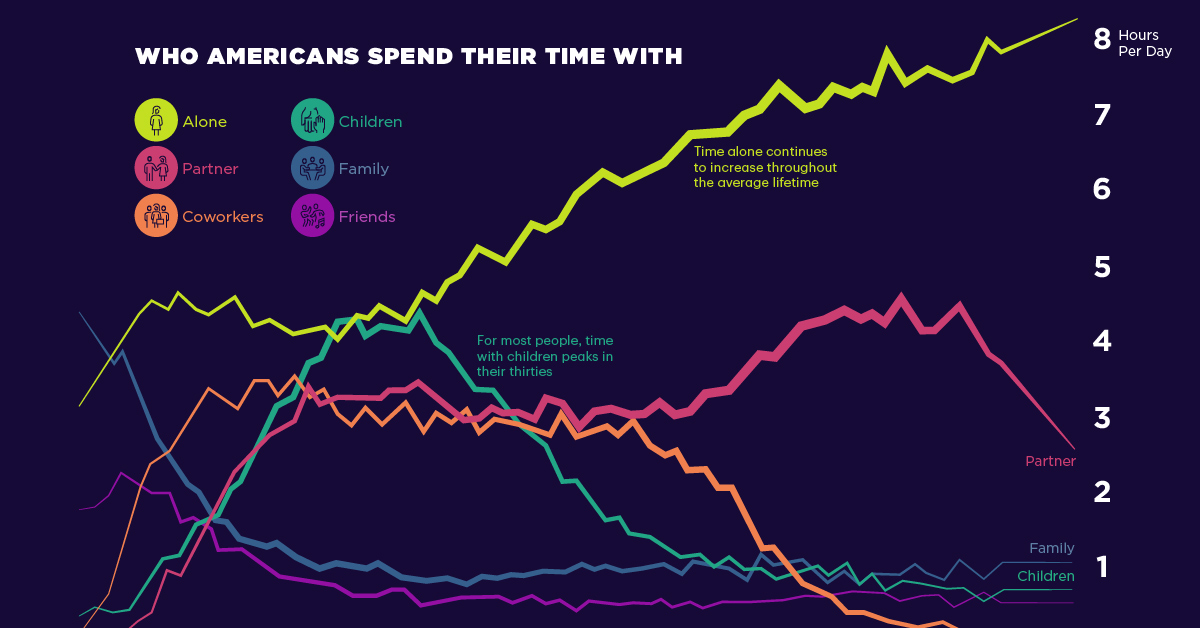
Throughout history, humans have relied on cooperation and social relationships to thrive. Of course, who we spend time with evolves throughout our lifetime.
Using insights from the American Time Use Survey and Our World in Data, we look at who Americans spend the most time with at various ages of their life.
Adolescence to Adulthood
In the average American’s teenage years, they spend most of their time alone and with their family. This makes sense, as the majority of people under 18 still live in a home with their nuclear family unit, meaning parents and siblings. Not surprisingly, adolescence is also when time spent with friends reaches its peak.
Jumping forward to a person’s early adulthood, 25-year-olds spend an average of 275 minutes per day alone, and 199 minutes with coworkers. This aligns with people in their twenties beginning to enter the workforce.
By age 35, people are still spending the most time with themselves, at 263 minutes per day. However, time spent combined with children and partners, the runner-ups, adds up to 450 minutes or around 7.5 hours a day.
| Age | Most Time Spent | Second | Third |
|---|---|---|---|
| 15 | Family - 267 Minutes | Alone - 193 Minutes | Friends - 109 Minutes |
| 25 | Alone - 275 Minutes | Coworkers - 199 Minutes | Partner - 121 Minutes |
| 35 | Alone - 263 Minutes | Children - 249 Minutes | Partner - 198 Minutes |
Although people are spending more time with kids and partners as they grow older, this trend may shift, as women are having fewer children. More women today are obtaining an education and are entering the workforce, causing them to delay or entirely put off having children.
Middle to Old Age
Upon turning 45, the average person spends 309 minutes a day alone, and in second place, 199 minutes with children. Time with coworkers remains relatively steady throughout someone’s forties, which coincides with the middle of career for most people in the workforce.
By age 55, time spent alone still takes top spot, but time spent with a partner goes up to 184 minutes, and time with coworkers also moves up, pushing out time spent with children.
| Age | Most Time Spent | Second | Third |
|---|---|---|---|
| 45 | Alone - 309 Minutes | Children - 199 Minutes | Partner - 184 Minutes |
| 55 | Alone - 384 Minutes | Partner - 184 Minutes | Coworkers - 163 Minutes |
| 65 | Alone - 444 Minutes | Partner - 243 Minutes | Family - 65 Minutes |
| 75 | Alone - 463 Minutes | Partner - 253 Minutes | Family - 56 Minutes |
Typically, time spent with children during the mid-fifties tends to see a sharp decline as children enter adulthood and begin to move out or spend more time out of the house.
Today, more children are staying at home longer or even moving back home. 52% of adult children in the U.S. today are living with their parents.
As people get closer to old age, around 65-years-old, they spend increasingly less time with coworkers as they begin to retire, and much more time alone or with a spouse. Then, from age 65-75, people consistently spend the most time alone, then with a partner and family.
Alone and Lonely?
One of the most significant trends on the chart is increased time spent alone.
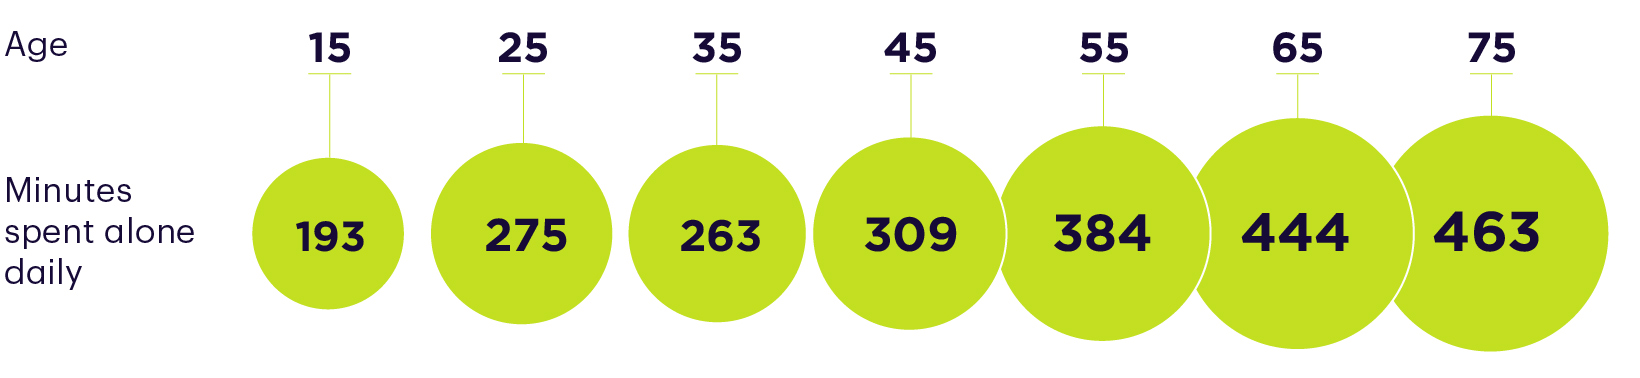
By the time someone reaches 80, their daily minutes alone goes up to 477. This can be a problematic reality. As the population continues to age in many countries around the world, more elderly people are left without resources or social connection.
Additionally, while one quarter of elderly Americans live alone, the trend of solo living is going up across nearly every age group, and this trend applies to a number of mature economies around the world.
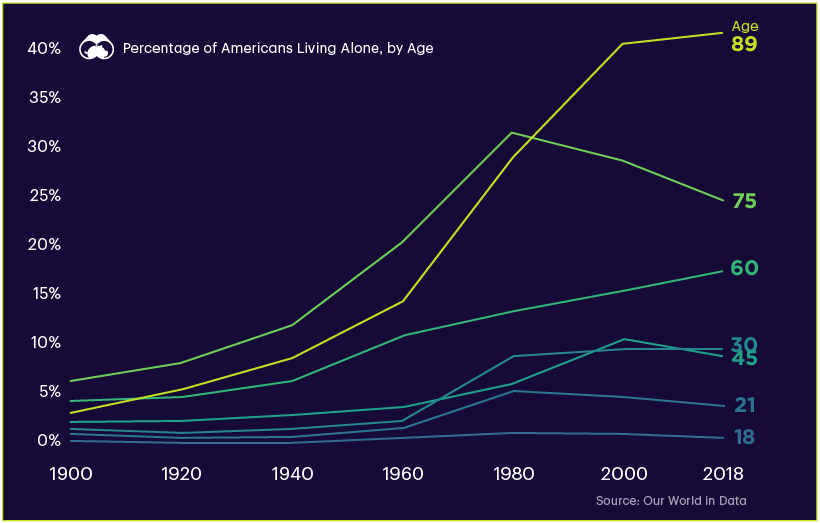
A natural conclusion would be that increasing alone time has negative impacts on people, however, being alone does not necessarily equate to loneliness. Our World in Data found that there was no direct correlation between living alone and reported feelings of loneliness.
One final consideration is the role technology plays in our social interactions. Thanks to smartphones and social platforms, time alone doesn’t necessarily equal isolation.
It is not just the amount of time spent with others, but the quality and expectations, that reduce loneliness.
Where does this data come from?
Source: U.S. Bureau of Labor Statistics American Time Use Survey, accessed on Our World in Data.
Notes: While respondents to the Time Use Survey are tracking their activity, they indicate who was present during each activity recorded. This results in the data used in this article. It’s worth noting that individuals can be counted twice, since people from various categories can be present at the same time.


Maps
The Largest Earthquakes in the New York Area (1970-2024)
The earthquake that shook buildings across New York in April 2024 was the third-largest quake in the Northeast U.S. over the past 50 years.


The Largest Earthquakes in the New York Area
This was originally posted on our Voronoi app. Download the app for free on Apple or Android and discover incredible data-driven charts from a variety of trusted sources.
The 4.8 magnitude earthquake that shook buildings across New York on Friday, April 5th, 2024 was the third-largest quake in the U.S. Northeast area over the past 50 years.
In this map, we illustrate earthquakes with a magnitude of 4.0 or greater recorded in the Northeastern U.S. since 1970, according to the United States Geological Survey (USGS).
Shallow Quakes and Older Buildings
The earthquake that struck the U.S. Northeast in April 2024 was felt by millions of people from Washington, D.C., to north of Boston. It even caused a full ground stop at Newark Airport.
The quake, occurring just 5 km beneath the Earth’s surface, was considered shallow, which is what contributed to more intense shaking at the surface.
According to the USGS, rocks in the eastern U.S. are significantly older, denser, and harder than those on the western side, compressed by time. This makes them more efficient conduits for seismic energy. Additionally, buildings in the Northeast tend to be older and may not adhere to the latest earthquake codes.
Despite disrupting work and school life, the earthquake was considered minor, according to the Michigan Technological University magnitude scale:
| Magnitude | Earthquake Effects | Estimated Number Each Year |
|---|---|---|
| 2.5 or less | Usually not felt, but can be recorded by seismograph. | Millions |
| 2.5 to 5.4 | Often felt, but only causes minor damage. | 500,000 |
| 5.5 to 6.0 | Slight damage to buildings and other structures. | 350 |
| 6.1 to 6.9 | May cause a lot of damage in very populated areas. | 100 |
| 7.0 to 7.9 | Major earthquake. Serious damage. | 10-15 |
| 8.0 or greater | Great earthquake. Can totally destroy communities near the epicenter. | One every year or two |
The largest earthquake felt in the area over the past 50 years was a 5.3 magnitude quake that occurred in Au Sable Forks, New York, in 2002. It damaged houses and cracked roads in a remote corner of the Adirondack Mountains, but caused no injuries.
| Date | Magnitude | Location | State |
|---|---|---|---|
| April 20, 2002 | 5.3 | Au Sable Forks | New York |
| October 7, 1983 | 5.1 | Newcomb | New York |
| April 5, 2024 | 4.8 | Whitehouse Station | New Jersey |
| October 16, 2012 | 4.7 | Hollis Center | Maine |
| January 16, 1994 | 4.6 | Sinking Spring | Pennsylvania |
| January 19, 1982 | 4.5 | Sanbornton | New Hampshire |
| September 25, 1998 | 4.5 | Adamsville | Pennsylvania |
| June 9, 1975 | 4.2 | Altona | New York |
| May 29, 1983 | 4.2 | Peru | Maine |
| April 23, 1984 | 4.2 | Conestoga | Pennsylvania |
| January 16, 1994 | 4.2 | Sinking Spring | Pennsylvania |
| November 3, 1975 | 4 | Long Lake | New York |
| June 17, 1991 | 4 | Worcester | New York |
The largest earthquake in U.S. history, however, was the 1964 Good Friday quake in Alaska, measuring 9.2 magnitude and killing 131 people.

-

 Technology2 weeks ago
Ranked: The Most Popular Smartphone Brands in the U.S.
-

 Automotive1 week ago
Almost Every EV Stock is Down After Q1 2024
-

 Money1 week ago
Where Does One U.S. Tax Dollar Go?
-

 Green2 weeks ago
Ranked: Top Countries by Total Forest Loss Since 2001
-

 Real Estate2 weeks ago
Visualizing America’s Shortage of Affordable Homes
-

 Maps2 weeks ago
Mapped: Average Wages Across Europe
-

 Mining2 weeks ago
Charted: The Value Gap Between the Gold Price and Gold Miners
-

 Demographics2 weeks ago
Visualizing the Size of the Global Senior Population