Brands
Which Streaming Service Has the Most Subscriptions?


Which Streaming Service Has The Most Subscriptions?
Many companies have launched a streaming service over the past few years, trying to capitalize on the digital media shift and launching the so-called “streaming wars.”
After Netflix grew from a small DVD-rental company to a household name, every media company from Disney to Apple saw recurring revenues ripe for the taking. Likewise, the audio industry has long-since accepted Spotify’s rise to prominence, as streaming has become the de facto method of consumption for many.
But it was actually the unexpected COVID-19 pandemic that solidified the foothold of digital streaming, with subscription services seeing massive growth over the last year. Although it was expected that many new services would flounder along the way, media subscription services saw wide scale growth and adoption almost across the board.
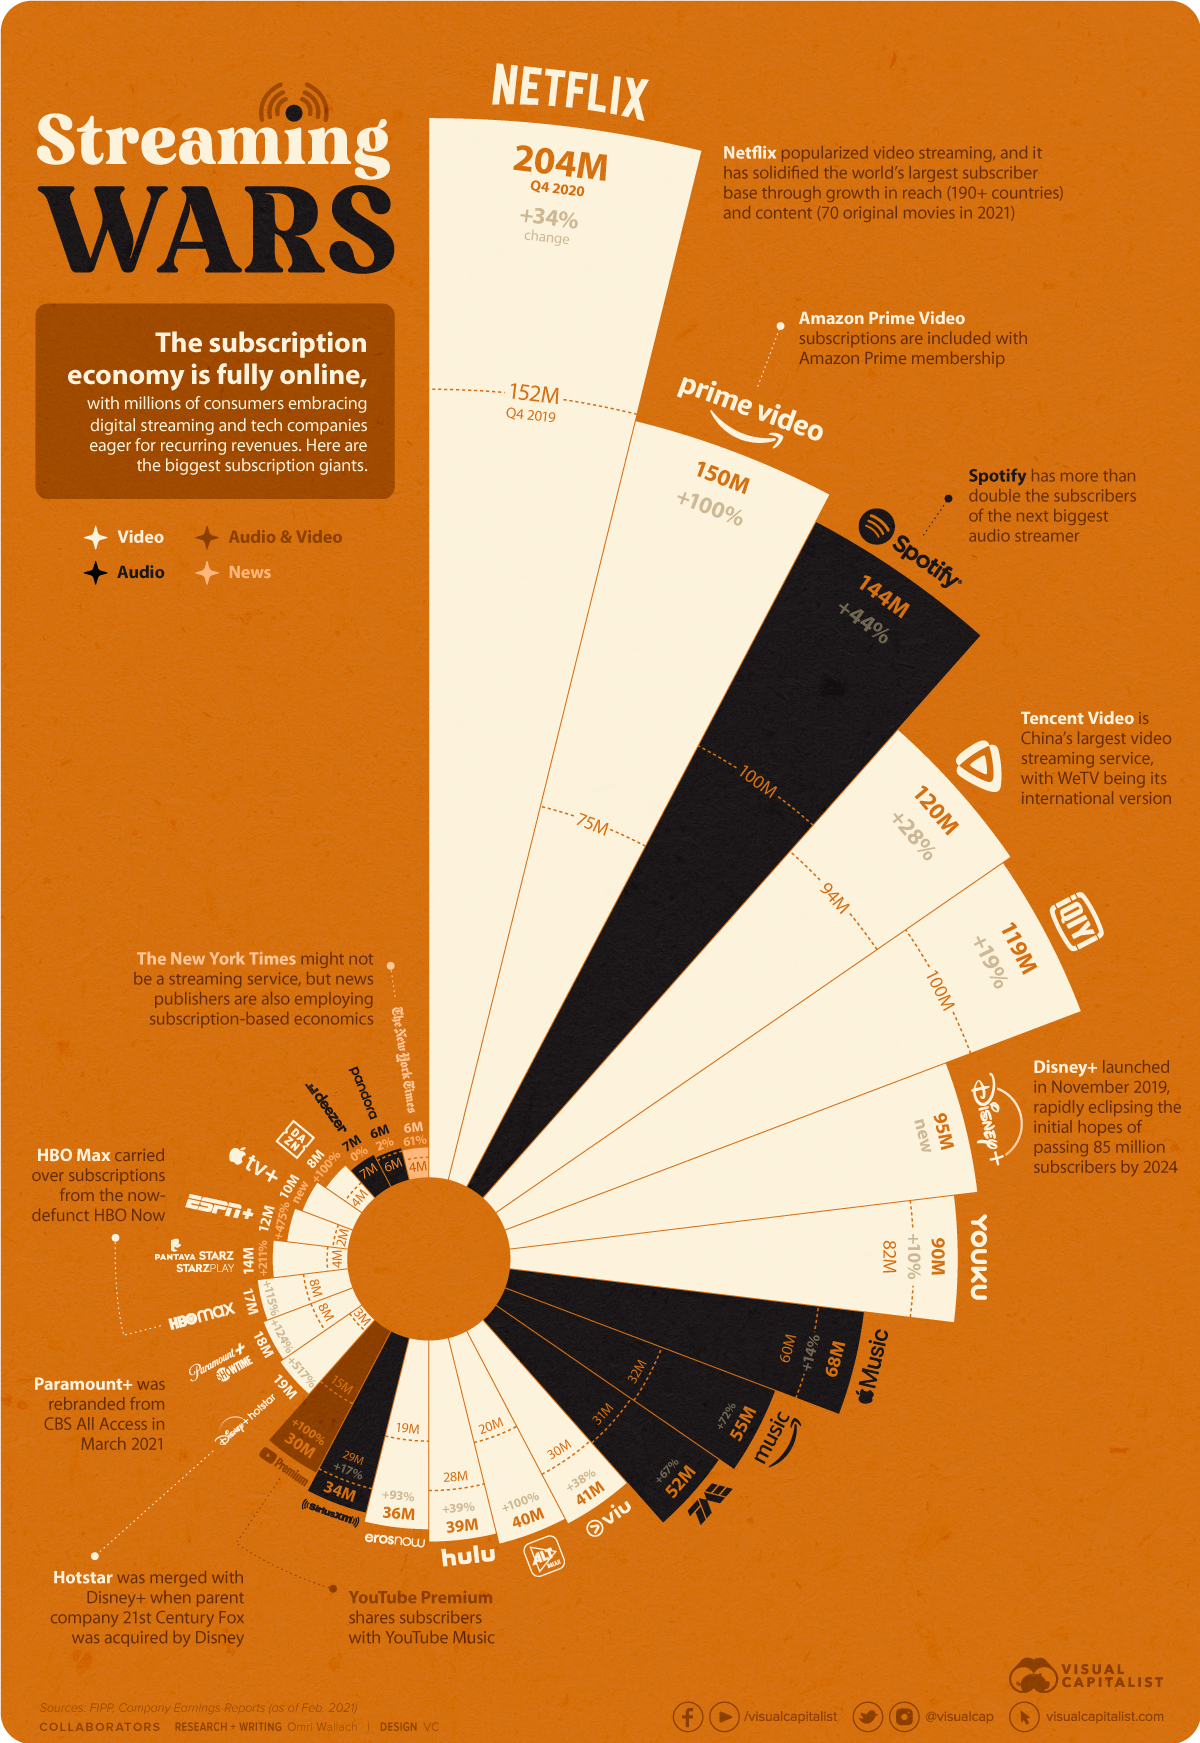
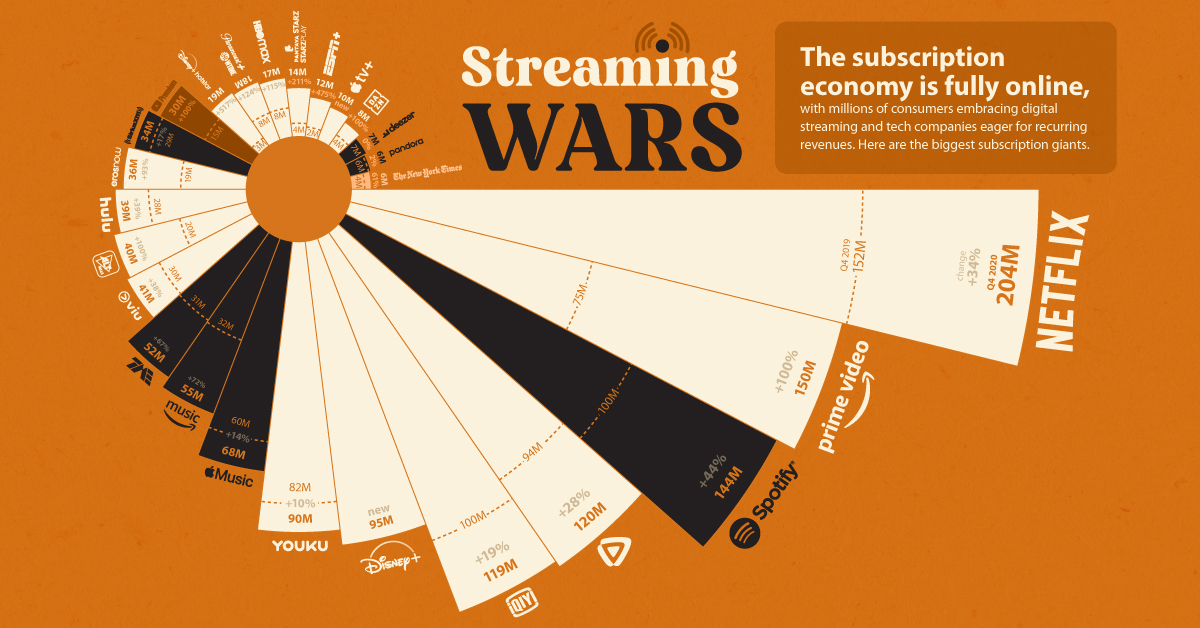
We’ve taken the video, audio, and news subscription services with 5+ million subscribers to see who came out on top—and who has grown the most quickly—over the past year. Data comes from the FIPP media association as well as individual company reports.
Streaming Service Giants: Netflix and Amazon
The top of the streaming giant pantheon highlights two staples of business: the first-mover advantage and the power of conglomeration.
With 200+ million global subscribers, Netflix has capitalized on its position as the first and primary name in digital video streaming. Though its consumer base in the Americas has begun to plateau, the company’s growth in reach (190+ countries) and content (70+ original movies slated for 2021) has put it more than 50 million subscribers ahead of its closest competition.
The story is the same in the audio market, where Spotify’s 144 million subscriber base is more than double that of Apple Music, the next closest competitor with 68 million subscribers.
Meanwhile, Amazon’s position as the second most popular video streaming service with 150 million subscribers might be surprising. However, Prime Video subscriptions are included with membership to Amazon Prime, which saw massive growth in usage during the pandemic.
| Service | Type | Subscribers (Q4 2020) |
|---|---|---|
| Netflix | Video | 203.7M |
| Amazon Prime Video | Video | 150.0M |
| Spotify | Audio | 144.0M |
| Tencent Video | Video | 120.0M |
| iQIYI | Video | 119.0M |
| Disney+ | Video | 94.9M |
| Youku | Video | 90.0M |
| Apple Music | Audio | 68.0M |
| Amazon Prime Music | Audio | 55.0M |
| Tencent Music (Group) | Audio | 51.7M |
| Viu | Video | 41.4M |
| Alt Balaji | Video | 40M |
| Hulu | Video | 38.8M |
| Eros Now | Video | 36.2M |
| Sirius Xm | Audio | 34.4M |
| YouTube Premium | Video/Audio | 30M |
| Disney+ Hotstar | Video | 18.5M |
| Paramount+ | Video | 17.9M |
| HBO Max | Video | 17.2M |
| Starz/StarzPlay/Pantaya | Video | 13.7M |
| ESPN+ | Video | 11.5M |
| Apple TV+ | Video | 10M |
| DAZN | Video | 8M |
| Deezer | Audio | 7M |
| Pandora | Audio | 6.3M |
| New York Times | News | 6.1M |
Another standout is the number of large streaming services based in Asia. China-based Tencent Video (also known as WeTV) and Baidu’s iQIYI streaming services both crossed 100 million paid subscribers, with Alibaba’s Youku not far behind with 90 million.
Disney Leads in Streaming Growth
But perhaps most notable of all is Disney’s rapid ascension to the upper echelons of streaming service giants.
Despite Disney+ launching in late 2019 with a somewhat lackluster content library (only one original series with one episode at launch), it has quickly rocketed both in terms of content and its subscriber base. With almost 95 million subscribers, it has amassed more subscribers in just over one year than Disney expected it could reach by 2024.
| Service | Type | Percentage Growth (2019) |
|---|---|---|
| Disney+ | Video | New |
| Apple TV+ | Video | New |
| Disney+ Hotstar | Video | 516.7% |
| ESPN+ | Video | 475.0% |
| Starz/StarzPlay/Pantaya | Video | 211.4% |
| Paramount+ | Video | 123.8% |
| HBO Max | Video | 115.0% |
| Amazon Prime Video | Video | 100.0% |
| Alt Balaji | Video | 100.0% |
| YouTube Premium | Video/Audio | 100.0% |
| DAZN | Video | 100.0% |
| Eros Now | Video | 92.6% |
| Amazon Prime Music | Audio | 71.9% |
| Tencent Music (Group) | Audio | 66.8% |
| New York Times | News | 60.5% |
| Spotify | Audio | 44.0% |
| Hulu | Video | 38.6% |
| Viu | Video | 38.0% |
| Netflix | Video | 34.4% |
| Tencent Video | Video | 27.7% |
| iQiyi | Video | 19.0% |
| Sirius Xm | Audio | 17.4% |
| Apple Music | Audio | 13.3% |
| Youku | Video | 9.6% |
| Pandora | Audio | 1.6% |
| Deezer | Audio | 0% |
The Disney+ wave also spurred growth in partner streaming services like Hotstar and ESPN+, while other services with smaller subscriber bases saw large growth rates thanks to the COVID-19 pandemic.
The lingering question is how the landscape will look when the pandemic starts to wind down, and when all the new players are accounted for. NBCUniversal’s Peacock, for example, has reached over 30 million subscribers as of January 2021, but the company hasn’t yet disclosed how many are paid subscribers.
Likewise, competitors are investing in content libraries to try and make up ground on Netflix and Disney. HBO Max is slated to start launching internationally in June 2021, and ViacomCBS rebranded and expanded CBS All Access into Paramount+.
And international growth is vital. Three of the top six video streaming services by subscribers are based in China, while Indian services Hotstar, ALTBalaji, and Eros Now all saw surges in subscriber bases, with more room left to grow.


Technology
How Tech Logos Have Evolved Over Time
From complete overhauls to more subtle tweaks, these tech logos have had quite a journey. Featuring: Google, Apple, and more.


How Tech Logos Have Evolved Over Time
This was originally posted on our Voronoi app. Download the app for free on iOS or Android and discover incredible data-driven charts from a variety of trusted sources.
One would be hard-pressed to find a company that has never changed its logo. Granted, some brands—like Rolex, IBM, and Coca-Cola—tend to just have more minimalistic updates. But other companies undergo an entire identity change, thus necessitating a full overhaul.
In this graphic, we visualized the evolution of prominent tech companies’ logos over time. All of these brands ranked highly in a Q1 2024 YouGov study of America’s most famous tech brands. The logo changes are sourced from 1000logos.net.
How Many Times Has Google Changed Its Logo?
Google and Facebook share a 98% fame rating according to YouGov. But while Facebook’s rise was captured in The Social Network (2010), Google’s history tends to be a little less lionized in popular culture.
For example, Google was initially called “Backrub” because it analyzed “back links” to understand how important a website was. Since its founding, Google has undergone eight logo changes, finally settling on its current one in 2015.
| Company | Number of Logo Changes |
|---|---|
| 8 | |
| HP | 8 |
| Amazon | 6 |
| Microsoft | 6 |
| Samsung | 6 |
| Apple | 5* |
Note: *Includes color changes. Source: 1000Logos.net
Another fun origin story is Microsoft, which started off as Traf-O-Data, a traffic counter reading company that generated reports for traffic engineers. By 1975, the company was renamed. But it wasn’t until 2012 that Microsoft put the iconic Windows logo—still the most popular desktop operating system—alongside its name.
And then there’s Samsung, which started as a grocery trading store in 1938. Its pivot to electronics started in the 1970s with black and white television sets. For 55 years, the company kept some form of stars from its first logo, until 1993, when the iconic encircled blue Samsung logo debuted.
Finally, Apple’s first logo in 1976 featured Isaac Newton reading under a tree—moments before an apple fell on his head. Two years later, the iconic bitten apple logo would be designed at Steve Jobs’ behest, and it would take another two decades for it to go monochrome.

-

 Markets1 week ago
U.S. Debt Interest Payments Reach $1 Trillion
-

 Business2 weeks ago
Charted: Big Four Market Share by S&P 500 Audits
-

 Real Estate2 weeks ago
Ranked: The Most Valuable Housing Markets in America
-

 Money2 weeks ago
Which States Have the Highest Minimum Wage in America?
-

 AI2 weeks ago
Ranked: Semiconductor Companies by Industry Revenue Share
-

 Markets2 weeks ago
Ranked: The World’s Top Flight Routes, by Revenue
-

 Demographics2 weeks ago
Population Projections: The World’s 6 Largest Countries in 2075
-

 Markets2 weeks ago
The Top 10 States by Real GDP Growth in 2023