Politics
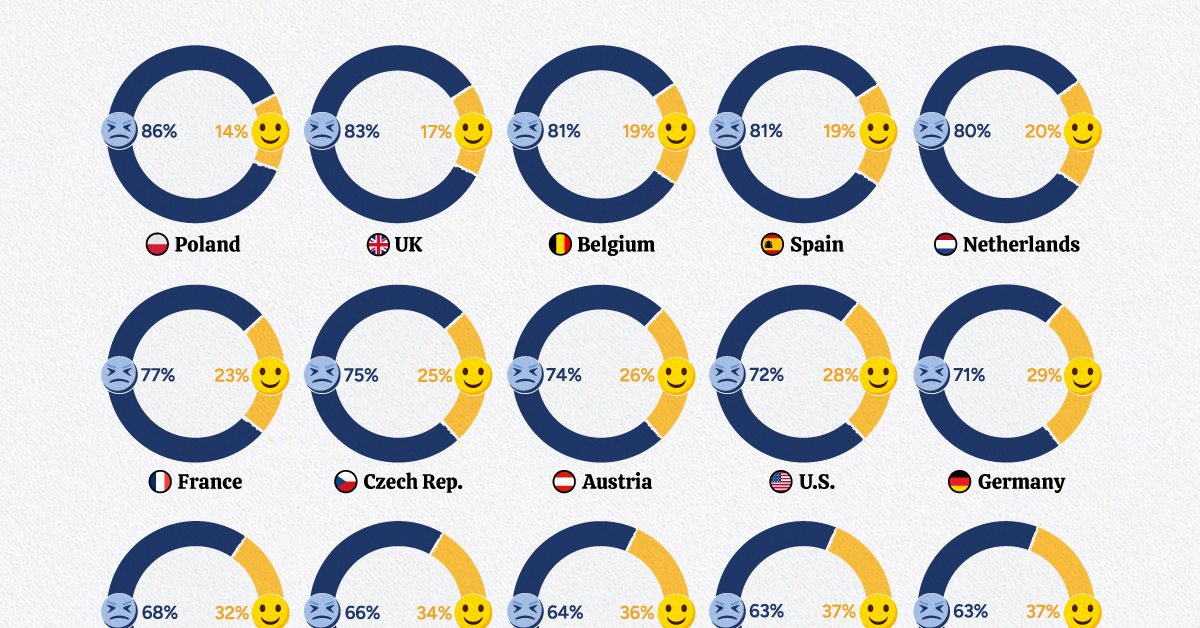
Which Populations Feel Their Country is on the Wrong Track?


Which Populations Feel Their Country is on the Wrong Track?
Plato once used the allegory of a Ship of Fools to push for his vision of a wise philosopher-king as the ideal pilot for a ship of state.
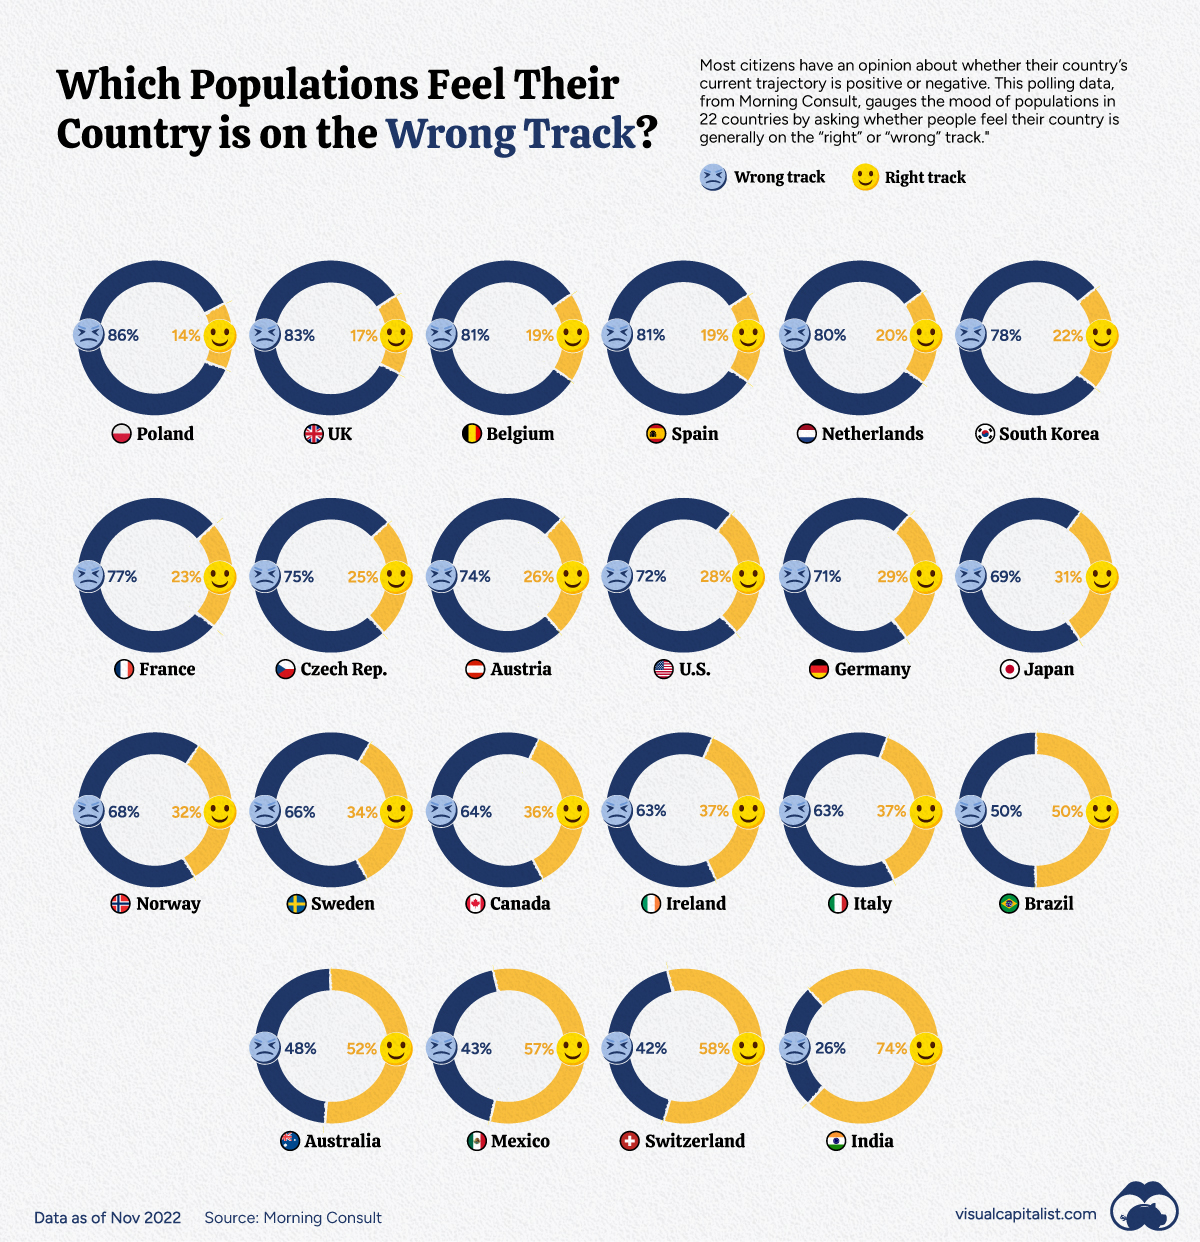
Looking at the most recent numbers from Morning Consult Political Intelligence’s Projections of Country Trajectories, you would be forgiven for thinking that a great many people believe that their ship of state is piloted by fools.
With the impact of the pandemic, rising inflation, and growing geopolitical instability, it’s probably not surprising that most respondents feel their countries are on the wrong track; India and Switzerland were notable exceptions.
Below are some of the stand-out stories that we found digging through the data.
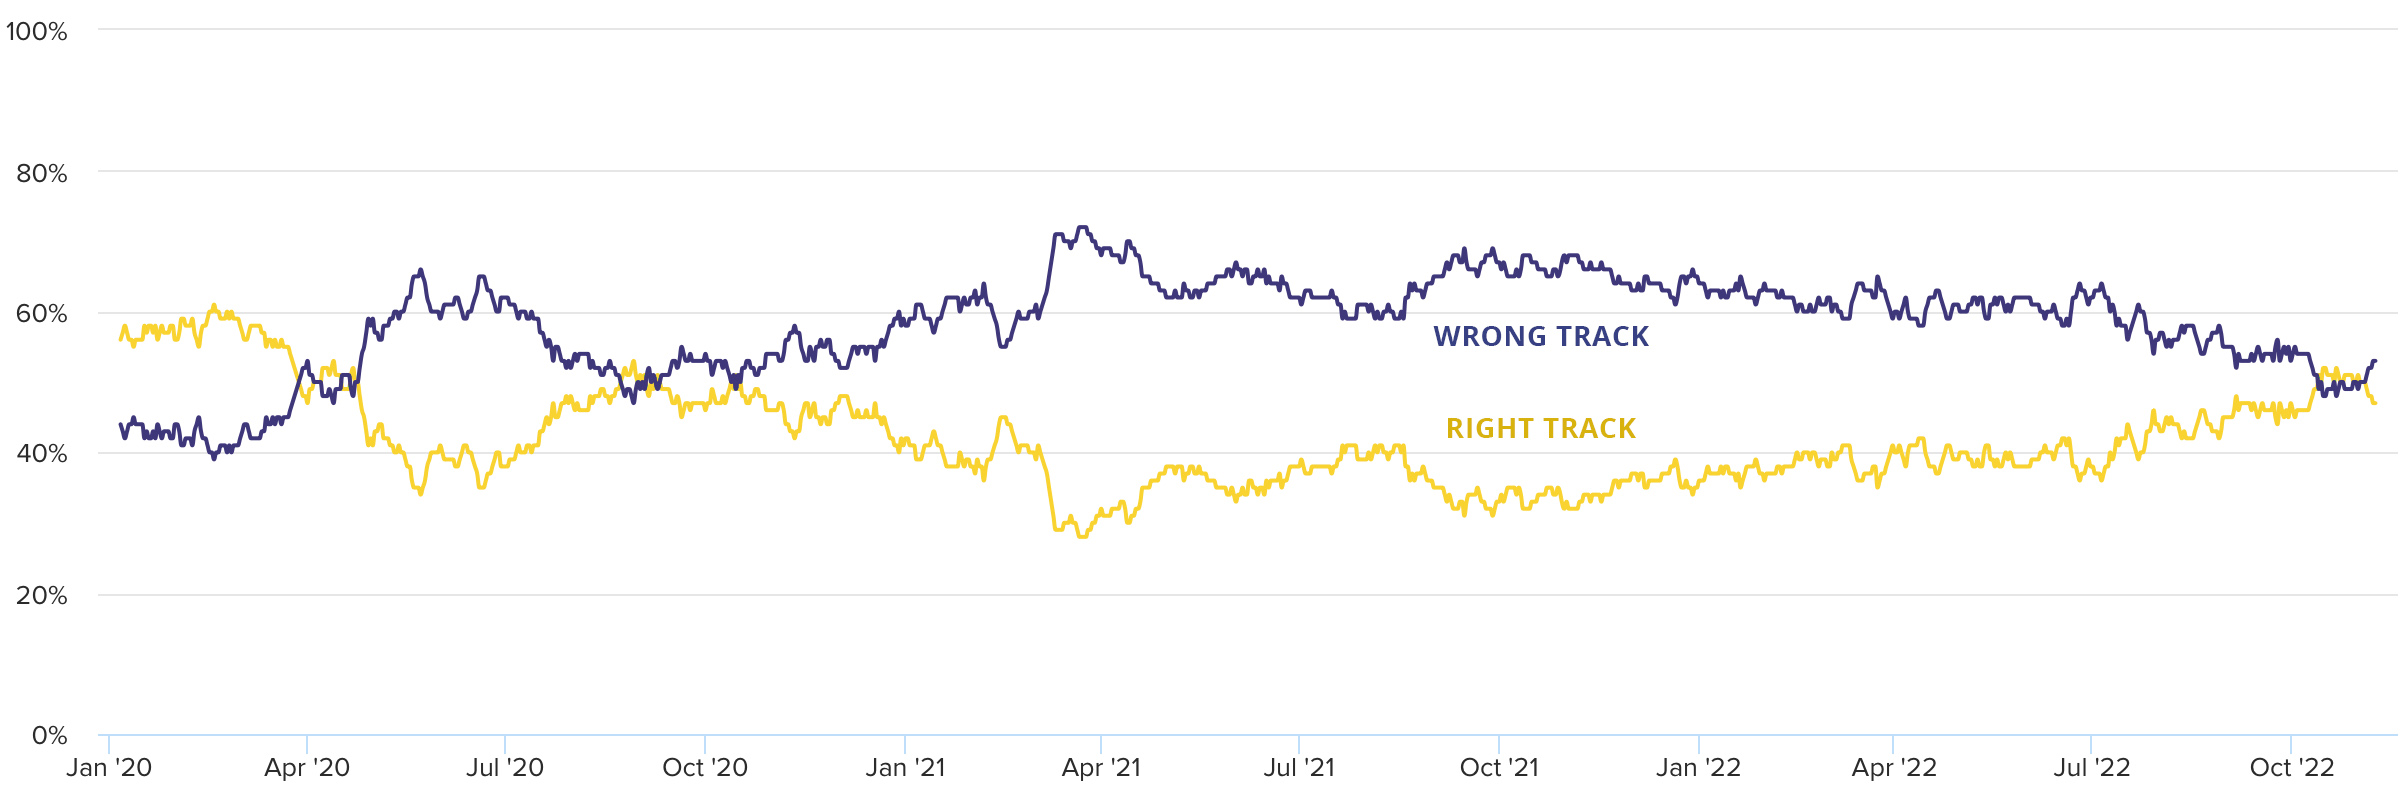
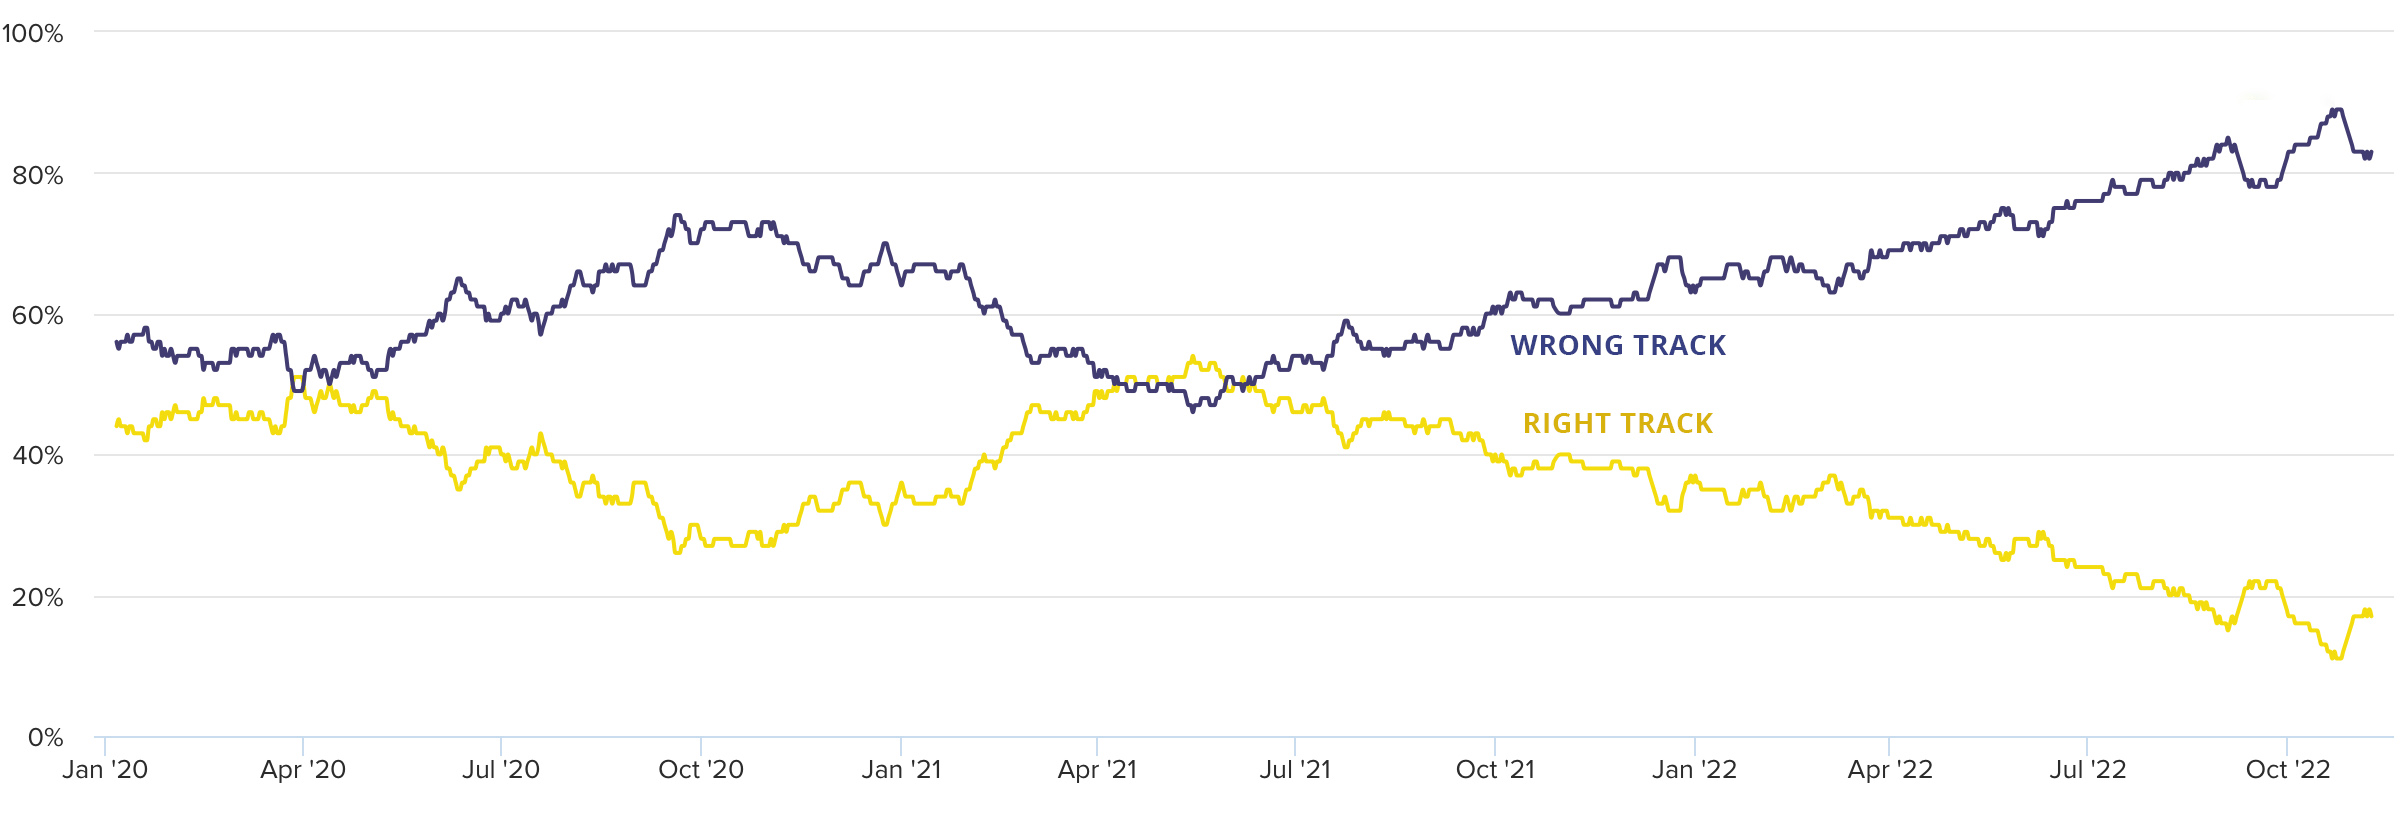
United States
Midterm elections have rarely been kind to the incumbent party in U.S. politics and the cost of living crisis, an unpopular president, and the aftermath of the global pandemic pointed towards an electoral bloodbath. This year’s election was also expected to set a new spending record, with over $9 billion raised.
Even so, despite 72% of respondents thinking that the country is on the wrong track, the governing Democrats have defied expectations and posted a historic performance during the November 8, 2022, midterm elections. To put this into context, in a president’s first term, there have been three previous instances (since 1922) of the incumbent’s party gaining (or not losing) Senate seats and losing fewer than 10 seats in the House.
Also worth noting is the large spike in negative sentiment in January 2021, following the U.S. Capitol attack, followed by the convergence of negative and positive sentiments as the peaceful transition of power became more assured.
Brazil
Horace, in Odes 1.14, describes a ship of state that is flailing at sea that eventually rights itself, claiming towards the end of the poem that “it’s my longing and no light love you carry.”
Something like that may be happening in Brazil following the loss of the often turbulent, COVID-19-denying President Jair Bolsonaro to political rival Luiz Inácio Lula da Silva in an Oct. 20, 2022, election runoff.
However, with respondents evenly split on where the country is going and the presidential election results being so close (50.9% vs. 49.1%), Lula will have his hands full governing a divided country.
India
While sentiment was overwhelmingly negative in almost every country tracked in this survey, India stood out as an outlier. India has consistently maintained a positive sentiment of between 60% and 80%, which is something only Switzerland comes close to.
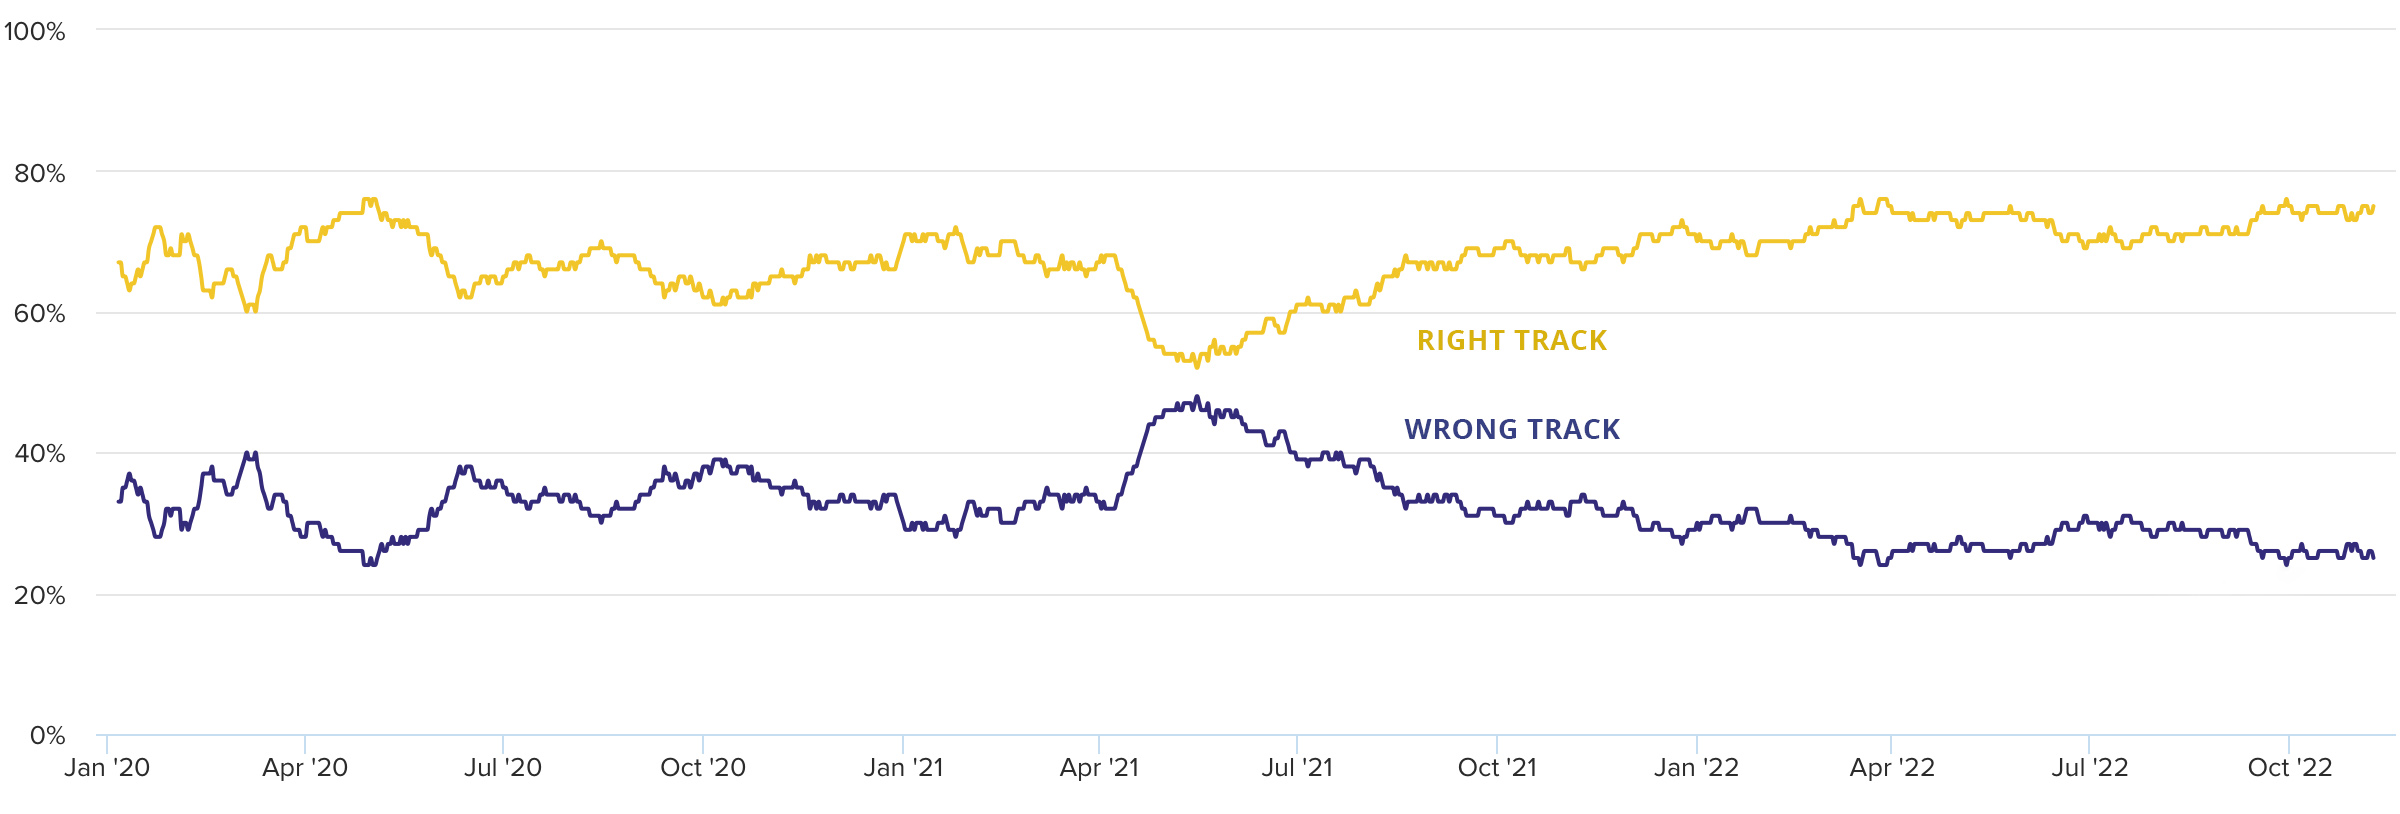
The only blip was a brief period during the spring of 2021. This coincided with a deadly second wave of COVID-19 infections in the country, on top of country-wide protests against the Narendra Modi government’s deeply unpopular farm bill.
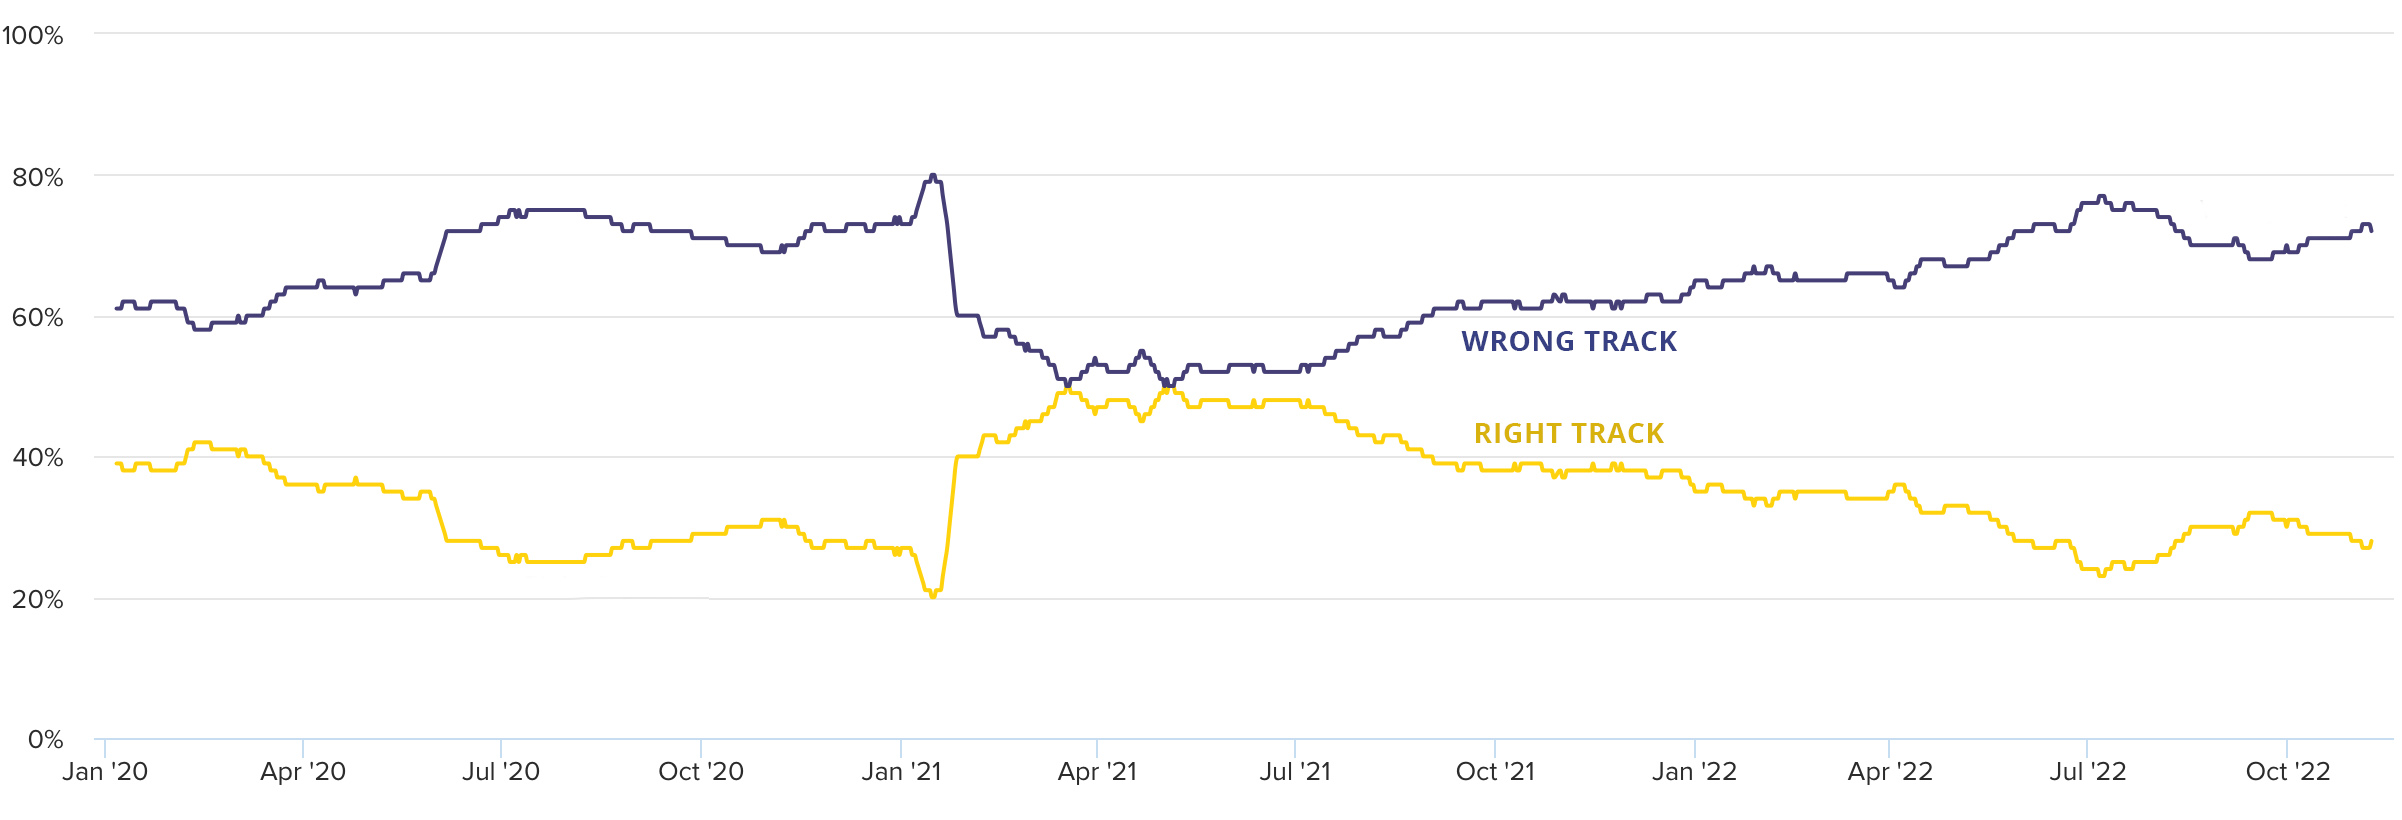
United Kingdom
The data here covers the three most recent UK Prime Ministers: Boris Johnson, Liz Truss, and now Rishi Sunak, the first South Asian to hold the post.
In January 2020, Johnson had just won a Tory majority and succeeded in “Getting Brexit Done.” Political scandals and the government’s pandemic response pushed the trendline down. It only recovered briefly in the spring of 2021, following Russia’s invasion of the Donbas region of Ukraine, which Johnson was widely seen as handling well. A personal visit to Kyiv on April 9, 2022, helped cement this.
Then followed Prime Minister Liz Truss’ disastrous mini-budget of Sept. 23, 2022, which saw the pound fall to the lowest-ever level against the dollar and the Bank of England intervene in the bond markets. The ascension of Rishi Sunak to No. 10 Downing Street has only just begun to turn around the low of 89% negative sentiment reported on Oct 23-25, 2022.
To quote the BBC comedy series, Yes, Minister, in another context, “the ship of state is the only ship that leaks from the top.”
Economy
The Bloc Effect: International Trade with Geopolitical Allies on the Rise
Rising geopolitical tensions are shaping the future of international trade, but what is the effect on trading among G7 and BRICS countries?


The Bloc Effect: International Trade with Allies on the Rise
International trade has become increasingly fragmented over the last five years as countries have shifted to trading more with their geopolitical allies.
This graphic from The Hinrich Foundation, the first in a three-part series covering the future of trade, provides visual context to the growing divide in trade in G7 and pre-expansion BRICS countries, which are used as proxies for geopolitical blocs.
Trade Shifts in G7 and BRICS Countries
This analysis uses IMF data to examine differences in shares of exports within and between trading blocs from 2018 to 2023. For example, we looked at the percentage of China’s exports with other BRICS members as well as with G7 members to see how these proportions shifted in percentage points (pp) over time.
Countries traded nearly $270 billion more with allies in 2023 compared to 2018. This shift came at the expense of trade with rival blocs, which saw a decline of $314 billion.
Country Change in Exports Within Bloc (pp) Change in Exports With Other Bloc (pp)
🇮🇳 India 0.0 3.9
🇷🇺 Russia 0.7 -3.8
🇮🇹 Italy 0.8 -0.7
🇨🇦 Canada 0.9 -0.7
🇫🇷 France 1.0 -1.1
🇪🇺 EU 1.1 -1.5
🇩🇪 Germany 1.4 -2.1
🇿🇦 South Africa 1.5 1.5
🇺🇸 U.S. 1.6 -0.4
🇯🇵 Japan 2.0 -1.7
🇨🇳 China 2.1 -5.2
🇧🇷 Brazil 3.7 -3.3
🇬🇧 UK 10.2 0.5
All shifts reported are in percentage points. For example, the EU saw its share of exports to G7 countries rise from 74.3% in 2018 to 75.4% in 2023, which equates to a 1.1 percentage point increase.
The UK saw the largest uptick in trading with other countries within the G7 (+10.2 percentage points), namely the EU, as the post-Brexit trade slump to the region recovered.
Meanwhile, the U.S.-China trade dispute caused China’s share of exports to the G7 to fall by 5.2 percentage points from 2018 to 2023, the largest decline in our sample set. In fact, partly as a result of the conflict, the U.S. has by far the highest number of harmful tariffs in place.
The Russia-Ukraine War and ensuing sanctions by the West contributed to Russia’s share of exports to the G7 falling by 3.8 percentage points over the same timeframe.
India, South Africa, and the UK bucked the trend and continued to witness advances in exports with the opposing bloc.
Average Trade Shifts of G7 and BRICS Blocs
Though results varied significantly on a country-by-country basis, the broader trend towards favoring geopolitical allies in international trade is clear.
Bloc Change in Exports Within Bloc (pp) Change in Exports With Other Bloc (pp)
Average 2.1 -1.1
BRICS 1.6 -1.4
G7 incl. EU 2.4 -1.0
Overall, BRICS countries saw a larger shift away from exports with the other bloc, while for G7 countries the shift within their own bloc was more pronounced. This implies that though BRICS countries are trading less with the G7, they are relying more on trade partners outside their bloc to make up for the lost G7 share.
A Global Shift in International Trade and Geopolitical Proximity
The movement towards strengthening trade relations based on geopolitical proximity is a global trend.
The United Nations categorizes countries along a scale of geopolitical proximity based on UN voting records.
According to the organization’s analysis, international trade between geopolitically close countries rose from the first quarter of 2022 (when Russia first invaded Ukraine) to the third quarter of 2023 by over 6%. Conversely, trade with geopolitically distant countries declined.
The second piece in this series will explore China’s gradual move away from using the U.S. dollar in trade settlements.
Visit the Hinrich Foundation to learn more about the future of geopolitical trade

-

 Economy5 hours ago
Economic Growth Forecasts for G7 and BRICS Countries in 2024
The IMF has released its economic growth forecasts for 2024. How do the G7 and BRICS countries compare?
-

 United States1 week ago
Ranked: The Largest U.S. Corporations by Number of Employees
We visualized the top U.S. companies by employees, revealing the massive scale of retailers like Walmart, Target, and Home Depot.
-

 Economy2 weeks ago
Where U.S. Inflation Hit the Hardest in March 2024
We visualized product categories that saw the highest % increase in price due to U.S. inflation as of March 2024.
-

 Economy4 weeks ago
G20 Inflation Rates: Feb 2024 vs COVID Peak
We visualize inflation rates across G20 countries as of Feb 2024, in the context of their COVID-19 pandemic peak.
-

 Economy1 month ago
Mapped: Unemployment Claims by State
This visual heatmap of unemployment claims by state highlights New York, California, and Alaska leading the country by a wide margin.
-

 Economy2 months ago
Confidence in the Global Economy, by Country
Will the global economy be stronger in 2024 than in 2023?


-

 Markets1 week ago
U.S. Debt Interest Payments Reach $1 Trillion
-

 Business2 weeks ago
Charted: Big Four Market Share by S&P 500 Audits
-

 Real Estate2 weeks ago
Ranked: The Most Valuable Housing Markets in America
-

 Money2 weeks ago
Which States Have the Highest Minimum Wage in America?
-

 AI2 weeks ago
Ranked: Semiconductor Companies by Industry Revenue Share
-

 Markets2 weeks ago
Ranked: The World’s Top Flight Routes, by Revenue
-

 Demographics2 weeks ago
Population Projections: The World’s 6 Largest Countries in 2075
-

 Markets2 weeks ago
The Top 10 States by Real GDP Growth in 2023