Datastream
Which Global Risks Have Worsened During the Pandemic?


The Briefing
- A new report from WEF found that social cohesion and overall livelihood have worsened the most since the start of the pandemic
- Policy measures and economic impacts from COVID-19 have exacerbated inequality, which has increased polarization and resentment among communities
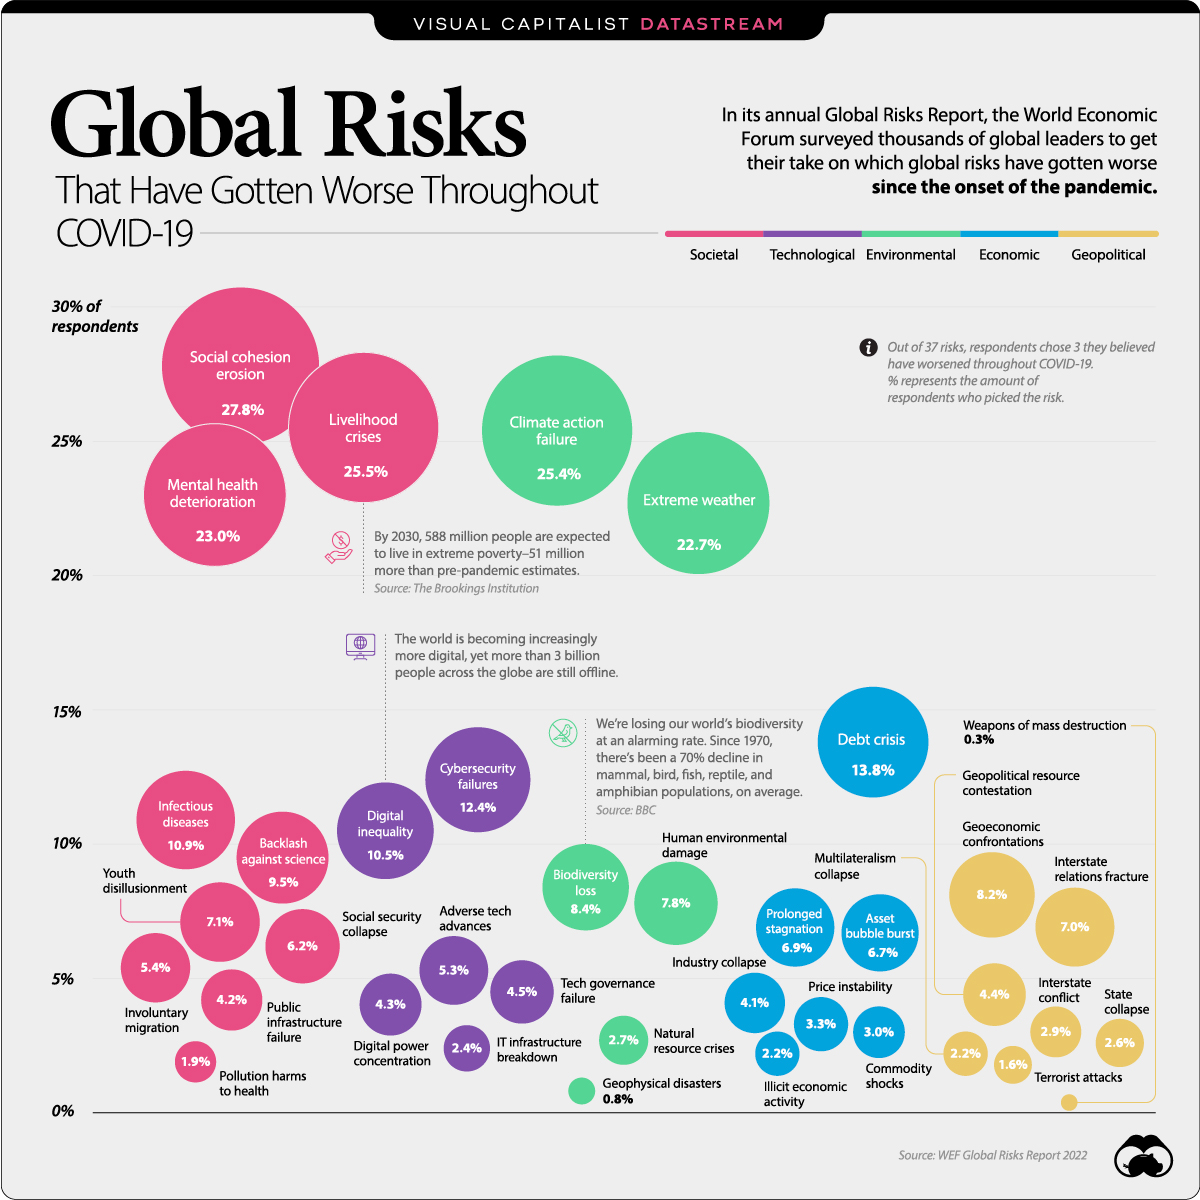
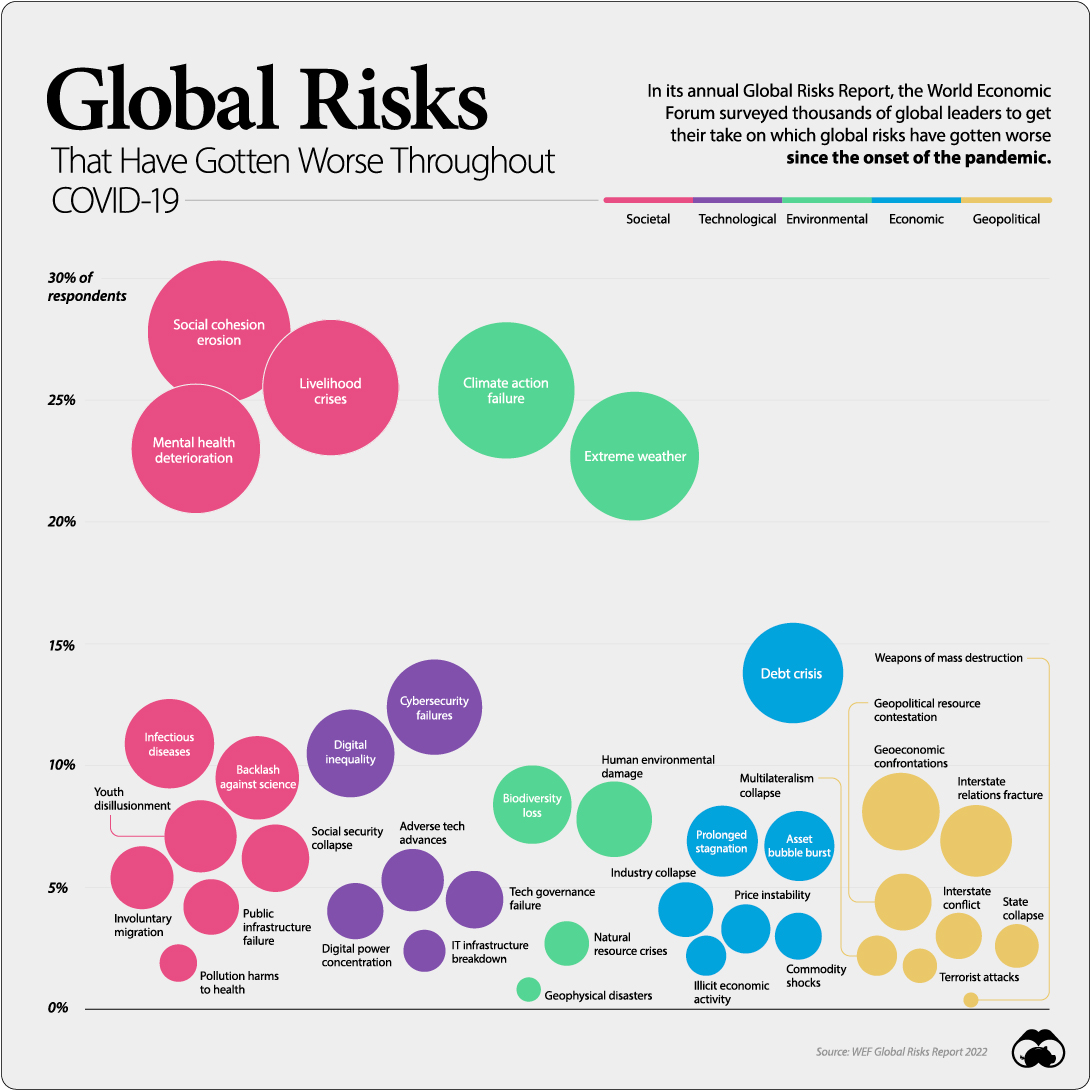
The Global Risks That Have Gotten Worse Since COVID-19
Each year, the World Economic Forum (WEF) puts together its Global Risks Report, an analysis of the top risks that pose a threat to the world.
The report includes data from nearly 1,000 surveyed leaders, across various organizations and regions. In this year’s report, respondents were asked which global risks have gotten worse since the start of the pandemic.
Here’s what they said.
Social Threats
According to respondents, the erosion of social cohesion is the global risk that has intensified the most since the start of the global pandemic. The WEF defines this as the loss of social capital or social stability.
| Risk | Category | % of respondents |
|---|---|---|
| Social cohesion erosion | Societal | 27.8% |
| Livelihood crises | Societal | 25.5% |
| Climate action failure | Environmental | 25.4% |
| Mental health deterioration | Societal | 23.0% |
| Extreme weather | Environmental | 22.7% |
| Debt crises | Economic | 13.8% |
| Cybersecurity failures | Technological | 12.4% |
| Infectious diseases | Societal | 10.9% |
| Digital inequality | Technological | 10.5% |
| Backlash against science | Societal | 9.5% |
| Biodiversity loss | Environmental | 8.4% |
| Geoeconomic confrontations | Geopolitical | 8.2% |
| Human environmental damage | Environmental | 7.8% |
| Youth disillusionment | Societal | 7.1% |
| Interstate relations fracture | Geopolitical | 7.0% |
| Prolonged stagnation | Economic | 6.9% |
| Asset bubble burst | Economic | 6.7% |
| Social security collapse | Societal | 6.2% |
| Involuntary migration | Societal | 5.4% |
| Adverse tech advances | Technological | 5.3% |
| Tech governance failure | Technological | 4.5% |
| Geopolitical resource contestation | Geopolitical | 4.4% |
| Digital power concentration | Technological | 4.3% |
| Public infrastructure failure | Societal | 4.2% |
| Industry collapse | Economic | 4.1% |
| Price instability | Economic | 3.3% |
| Commodity shocks | Economic | 3.0% |
| Interstate conflict | Geopolitical | 2.9% |
| Natural resource crises | Environmental | 2.7% |
| State collapse | Geopolitical | 2.6% |
| IT infrastructure breakdown | Technological | 2.4% |
| Multilateralism collapse | Geopolitical | 2.2% |
| Illicit economic activity | Economic | 2.2% |
| Pollution harms to health | Societal | 1.9% |
| Terrorist attacks | Geopolitical | 1.6% |
| Geophysical disasters | Environmental | 0.8% |
| Weapons of mass destruction | Geopolitical | 0.3% |
Inequality existed long before COVID-19, but the pandemic has only made things worse.
For example, employment recovery has been uneven across the United States. High-wage workers have seen employment rates bounce back fairly quickly after their Spring 2020 slump, while low-wage workers haven’t recovered at the same rate.
As of August 2021, employment rates for those making below $27K a year were still down 25% compared to pre-pandemic levels.
Environmental Threats
In addition to societal threats, a couple environmental risks made it to the top of the list as well. Both Climate action failure and extreme weather were in the top five.
Considering how difficult it’s been for international governments to collaborate on COVID-19 relief efforts, respondents feel less than optimistic that we’ll manage to seamlessly deal with the chaos that could come from environmental risks, which are similarly complex.
Which global risk do you think has worsened the most since the start of the pandemic?
Where does this data come from?
Source: WEF Global Risks Report 2022
Details: Data in this report is from the The Global Risks Perception Survey (GRPS), the World Economic Forum’s source of original risks data. Survey responses were collected from 8 September to 12 October 2021. See the report for full details on methodology.


Datastream
Can You Calculate Your Daily Carbon Footprint?
Discover how the average person’s carbon footprint impacts the environment and learn how carbon credits can offset your carbon footprint.


The Briefing
- A person’s carbon footprint is substantial, with activities such as food consumption creating as much as 4,500 g of CO₂ emissions daily.
- By purchasing carbon credits from Carbon Streaming Corporation, you can offset your own emissions and fund positive climate action.
Your Everyday Carbon Footprint
While many large businesses and countries have committed to net-zero goals, it is essential to acknowledge that your everyday activities also contribute to global emissions.
In this graphic, sponsored by Carbon Streaming Corporation, we will explore how the choices we make and the products we use have a profound impact on our carbon footprint.
Carbon Emissions by Activity
Here are some of the daily activities and products of the average person and their carbon footprint, according to Clever Carbon.
| Household Activities & Products | CO2 Emissions (g) |
|---|---|
| 💡 Standard Light Bulb (100 watts, four hours) | 172 g |
| 📱 Mobile Phone Use (195 minutes per day)* | 189 g |
| 👕 Washing Machine (0.63 kWh) | 275 g |
| 🔥 Electric Oven (1.56 kWh) | 675 g |
| ♨️ Tumble Dryer (2.5 kWh) | 1,000 g |
| 🧻 Toilet Roll (2 ply) | 1,300 g |
| 🚿 Hot Shower (10 mins) | 2,000 g |
| 🚙 Daily Commute (one hour, by car) | 3,360 g |
| 🍽️ Average Daily Food Consumption (three meals of 600 calories) | 4,500 g |
| *Phone use based on yearly use of 69kg per the source, Reboxed | |
Your choice of transportation plays a crucial role in determining your carbon footprint. For instance, a 15 km daily commute to work on public transport generates an average of 1,464 g of CO₂ emissions. Compared to 3,360 g—twice the volume for a journey the same length by car.
By opting for more sustainable modes of transport, such as cycling, walking, or public transportation, you can significantly reduce your carbon footprint.
Addressing Your Carbon Footprint
One way to compensate for your emissions is by purchasing high-quality carbon credits.
Carbon credits are used to help fund projects that avoid, reduce or remove CO₂ emissions. This includes nature-based solutions such as reforestation and improved forest management, or technology-based solutions such as the production of biochar and carbon capture and storage (CCS).
While carbon credits offer a potential solution for individuals to help reduce global emissions, public awareness remains a significant challenge. A BCG-Patch survey revealed that only 34% of U.S. consumers are familiar with carbon credits, and only 3% have purchased them in the past.
About Carbon Streaming
By financing the creation or expansion of carbon projects, Carbon Streaming Corporation secures the rights to future carbon credits generated by these sustainable projects. You can then purchase these carbon credits to help fund climate solutions around the world and compensate for your own emissions.
Ready to get involved?
>> Learn more about purchasing carbon credits at Carbon Streaming

-

 Maps2 weeks ago
Mapped: Average Wages Across Europe
-

 Money1 week ago
Which States Have the Highest Minimum Wage in America?
-

 Real Estate1 week ago
Ranked: The Most Valuable Housing Markets in America
-

 Markets1 week ago
Charted: Big Four Market Share by S&P 500 Audits
-

 AI1 week ago
The Stock Performance of U.S. Chipmakers So Far in 2024
-

 Automotive1 week ago
Almost Every EV Stock is Down After Q1 2024
-

 Money2 weeks ago
Where Does One U.S. Tax Dollar Go?
-

 Green2 weeks ago
Ranked: Top Countries by Total Forest Loss Since 2001