Economy
Which Country is the Cheapest for Starting a Business?
View the full-size infographic map
Which Country is the Cheapest for Starting A Business?
Starting a new business isn’t as simple as coming up with an idea.
In addition to the time investment needed to formulate and create a business, there’s often a hefty capital requirement. A new business usually requires paying different fees for licensing, permits, and approvals, and many governments also have minimum on-hand capital requirements.
And costs are relative. Though it might be more costly to start a business in some countries on paper, affordability also takes into account relative income.
These graphics from BusinessFinancing.co.uk use data from the World Bank’s Doing Business 2020 report to examine the startup cost for a small-to-medium-size LLC in the largest business cities across 190 countries.
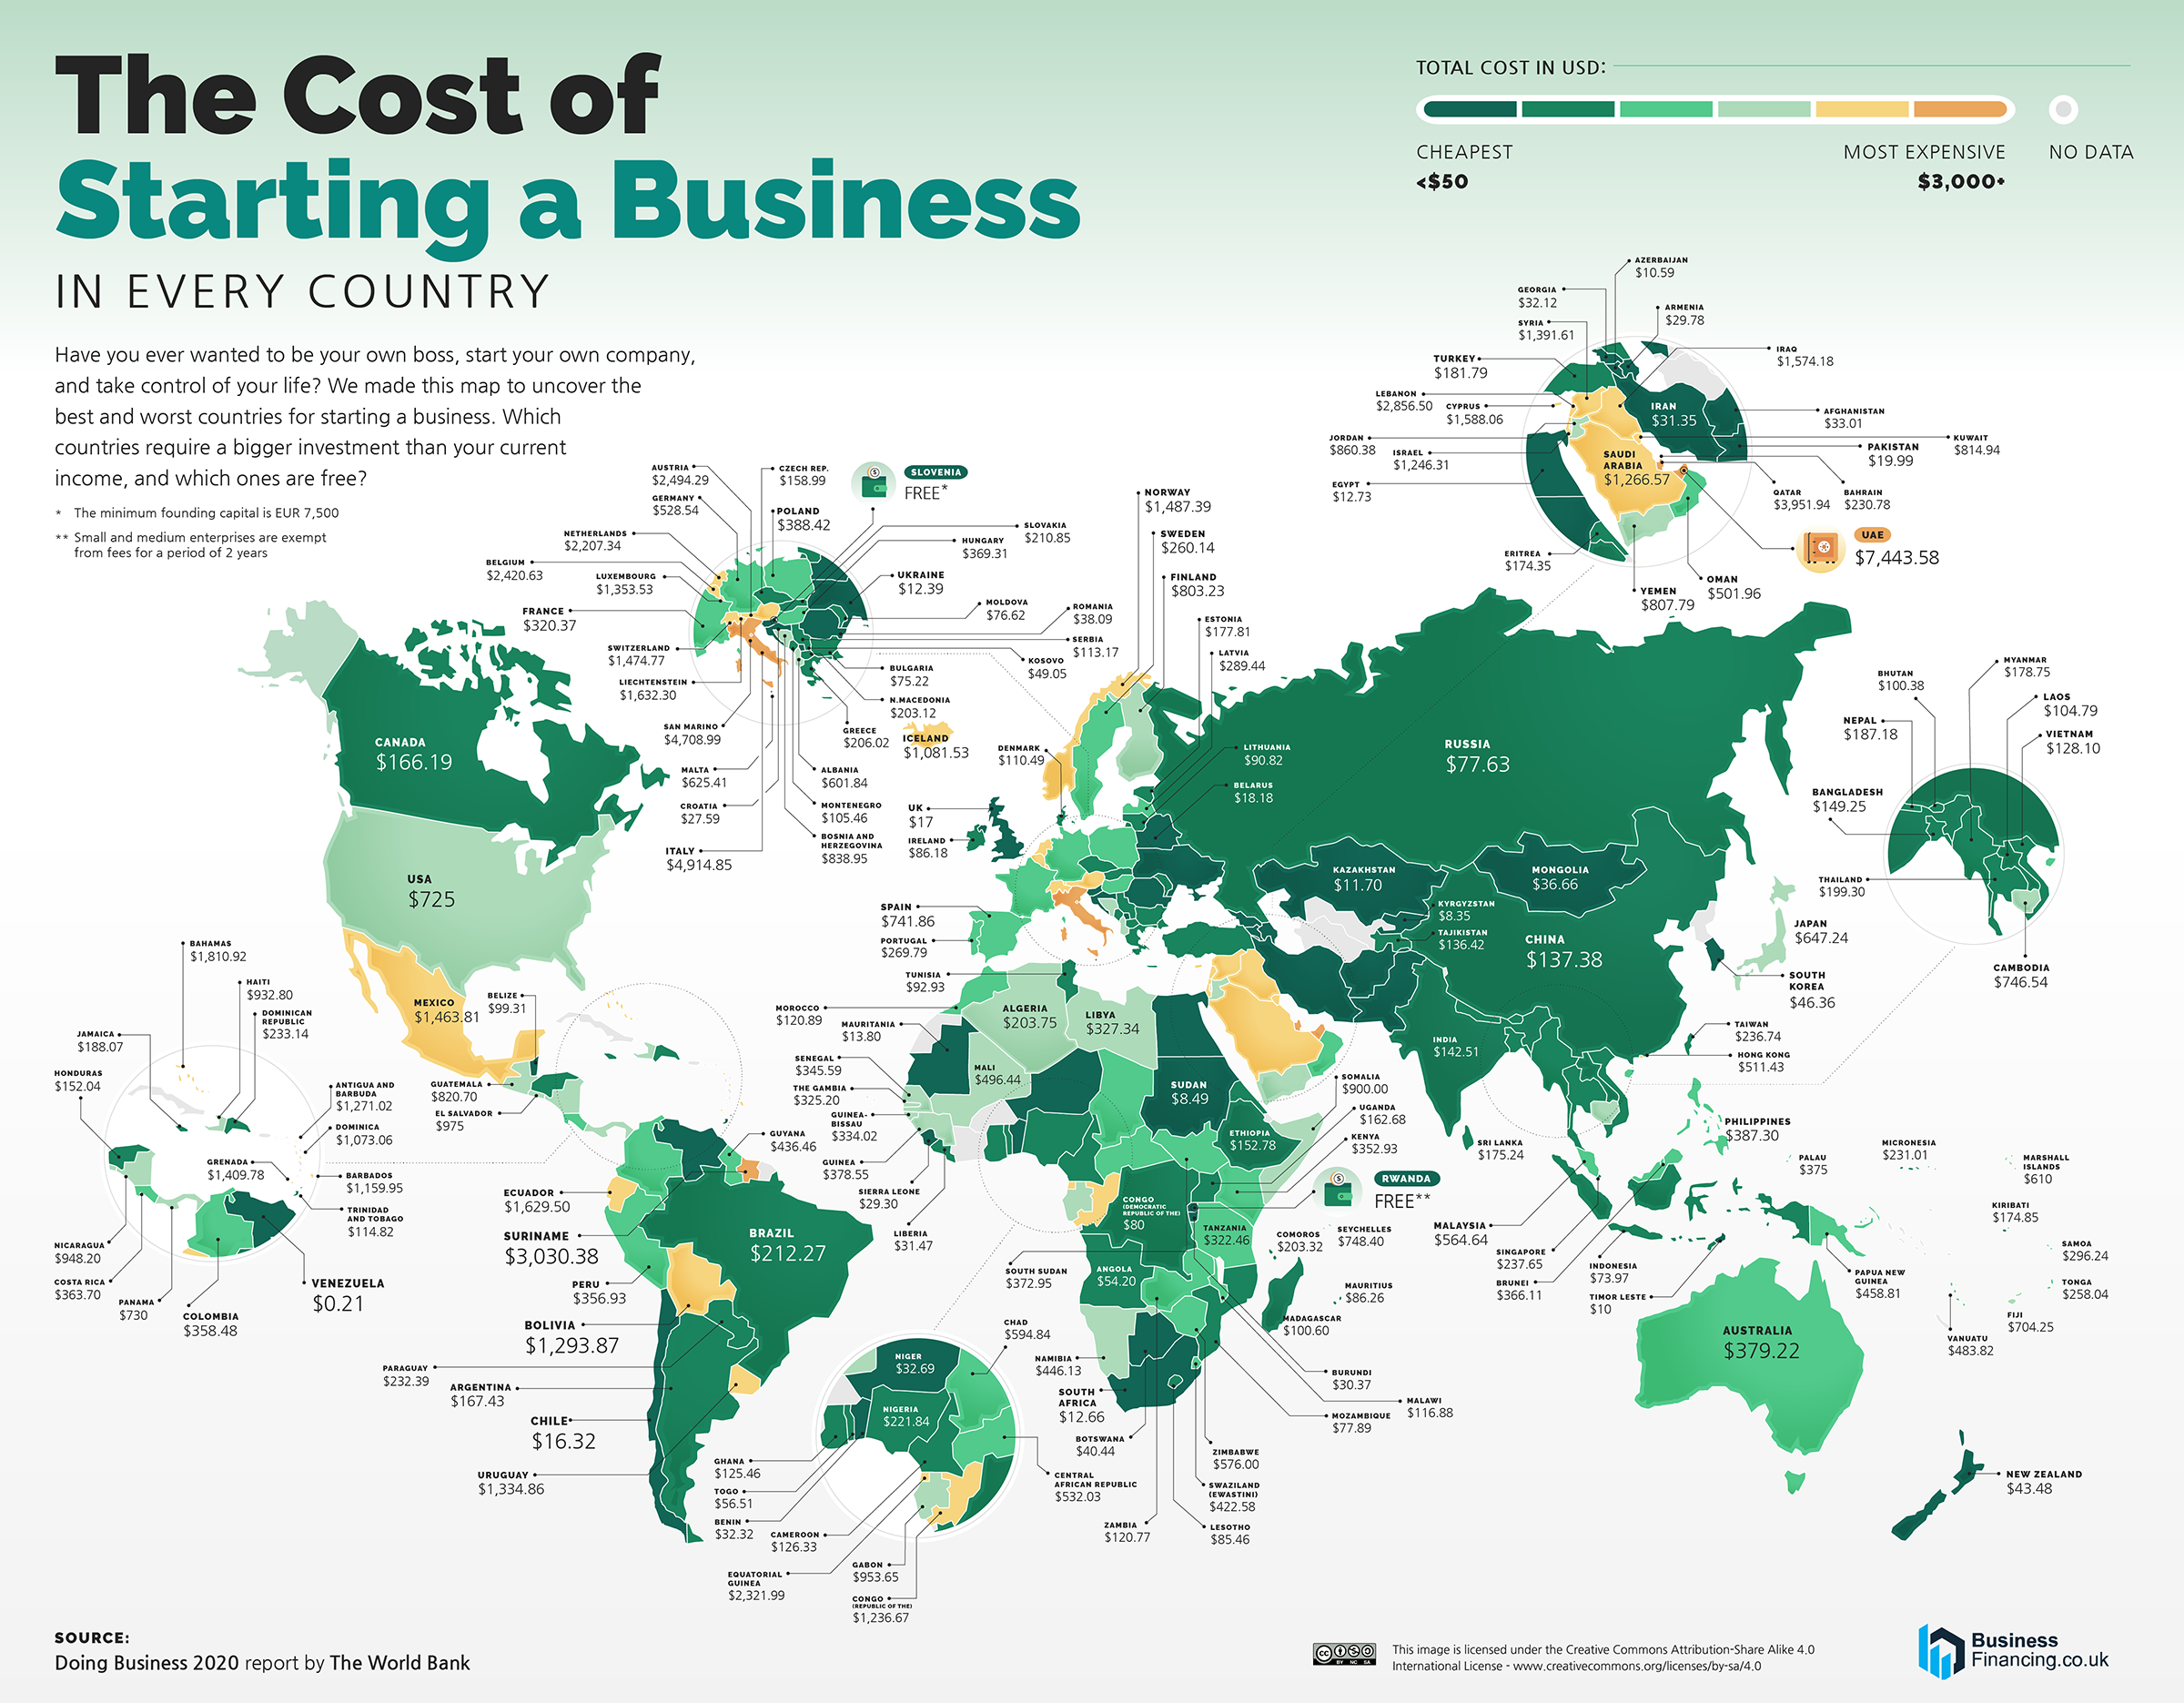
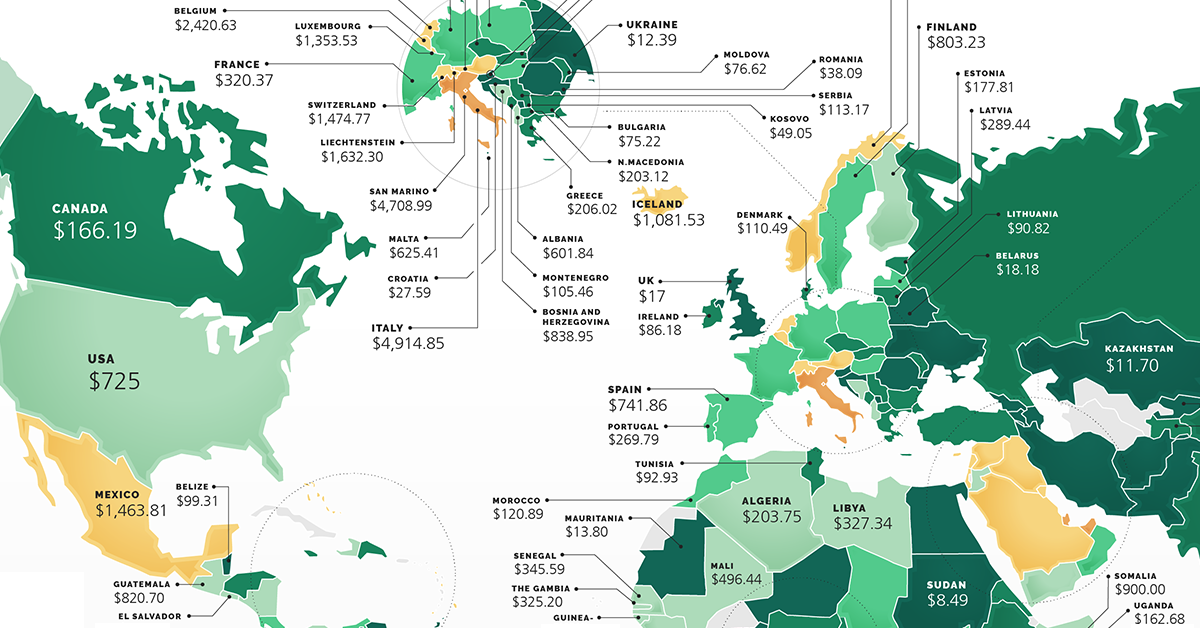
The Cost of Starting a Business in Different Countries
From a pure cost perspective, the affordability of starting a business is extremely dependent on where you are located.
Some countries make the cost of business extremely low to encourage more economic activity. Others have high or nearly inaccessible fees to protect existing businesses, or to simply cash in on the entrepreneurial spirit.
| Country | Cost (2020 USD) | % of Monthly Income |
|---|---|---|
| Venezuela | 0 | -% |
| Rwanda | 0 | -% |
| Slovenia | 0 | -% |
| Kyrgyzstan | 8 | 0.1 |
| Sudan | 8 | 0.13 |
| Timor Leste | 10 | 0.09 |
| Azerbaijan | 11 | 0.04 |
| Kazakhstan | 12 | 0.02 |
| Ukraine | 12 | 0.06 |
| Egypt | 13 | 0.07 |
| South Africa | 13 | 0.03 |
| Mauritania | 14 | 0.12 |
| Uzbekistan | 14 | 0.13 |
| Chile | 16 | 0.02 |
| United Kingdom | 17 | 0.01 |
| Belarus | 18 | 0.04 |
| Pakistan | 20 | 0.16 |
| Croatia | 27 | 0.03 |
| Sierra Leone | 29 | 0.81 |
| Armenia | 30 | 0.1 |
| Burundi | 30 | 1.77 |
| Iran | 31 | 0.09 |
| Benin | 32 | 0.38 |
| Liberia | 32 | 0.87 |
| Niger | 32 | 0.78 |
| Afghanistan | 33 | 0.86 |
| Georgia | 33 | 0.1 |
| Mongolia | 37 | 0.17 |
| Romania | 38 | 0.05 |
| Botswana | 40 | 0.08 |
| New Zealand | 43 | 0.02 |
| South Korea | 47 | 0.02 |
| Kosovo | 49 | -% |
| Angola | 54 | 0.63 |
| Togo | 56 | 1.29 |
| Indonesia | 74 | 0.3 |
| Bulgaria | 75 | 0.11 |
| Moldova | 76 | 0.24 |
| Mozambique | 76 | 2.09 |
| Russia | 77 | 0.11 |
| Congo (Democratic Republic of the) | 80 | 2.39 |
| Ireland | 86 | 0.02 |
| Lesotho | 86 | 0.89 |
| Mauritius | 86 | 0.1 |
| Lithuania | 90 | 0.07 |
| Tunisia | 93 | 0.42 |
| Belize | 99 | 0.33 |
| Bhutan | 100 | 0.45 |
| Madagascar | 100 | 2.72 |
| Laos | 105 | 0.68 |
| Montenegro | 105 | 0.16 |
| Denmark | 110 | 0.02 |
| Serbia | 112 | 0.24 |
| Trinidad and Tobago | 115 | 0.1 |
| Malawi | 117 | 4.72 |
| Morocco | 120 | 0.52 |
| Zambia | 120 | 1.28 |
| Cameroon | 125 | 1.24 |
| Ghana | 125 | 1.03 |
| Vietnam | 128 | 0.73 |
| Tajikistan | 136 | 1.86 |
| China | 138 | 0.21 |
| India | 142 | 0.98 |
| Bangladesh | 149 | 1.11 |
| Ethiopia | 150 | 3.21 |
| Honduras | 152 | 0.85 |
| Czech Republic | 158 | 0.13 |
| Uganda | 163 | 3.67 |
| Canada | 165 | 0.05 |
| Argentina | 167 | 0.21 |
| Eritrea | 174 | 4.63 |
| Kiribati | 174 | 0.7 |
| Estonia | 176 | 0.11 |
| Sri Lanka | 176 | 0.56 |
| Turkey | 177 | 0.28 |
| Myanmar | 179 | 1.73 |
| Nepal | 186 | 2.43 |
| Jamaica | 189 | 0.48 |
| Thailand | 201 | 0.43 |
| North Macedonia | 202 | 0.52 |
| Algeria | 203 | 0.79 |
| Comoros | 204 | 1.9 |
| Greece | 204 | 0.14 |
| Slovakia | 209 | 0.17 |
| Brazil | 218 | 0.35 |
| Nigeria | 223 | 1.68 |
| Bahrain | 231 | 0.14 |
| Micronesia, Federated States of | 231 | 0.82 |
| Paraguay | 232 | 0.61 |
| Dominican Republic | 233 | 0.39 |
| Singapore | 238 | 0.06 |
| Taiwan | 239 | -% |
| Sweden | 259 | 0.07 |
| Tonga | 262 | 0.78 |
| Portugal | 268 | 0.17 |
| Latvia | 287 | 0.25 |
| Samoa | 296 | 1 |
| France | 318 | 0.11 |
| Tanzania | 322 | 4.55 |
| The Gambia | 326 | 6.71 |
| Libya | 328 | 0.59 |
| Guinea-Bissau | 332 | 5.72 |
| Senegal | 343 | 3.35 |
| Kenya | 353 | 3.01 |
| Peru | 355 | 0.77 |
| Costa Rica | 363 | 0.4 |
| Colombia | 364 | 0.85 |
| Brunei | 366 | 0.18 |
| Hungary | 369 | 0.34 |
| South Sudan | 373 | 5.31 |
| Palau | 375 | -% |
| Australia | 377 | 0.1 |
| Guinea | 380 | 6.42 |
| Poland | 387 | 0.36 |
| Philippines | 389 | 1.44 |
| Swaziland (Eswatini) | 425 | 1.59 |
| Guyana | 436 | 1.29 |
| Namibia | 446 | 1.15 |
| Papua New Guinea | 459 | 2.71 |
| Vanuatu | 484 | 2.04 |
| Mali | 493 | 8.02 |
| Oman | 502 | 0.65 |
| Hong Kong | 512 | 1.2 |
| Germany | 524 | 0.16 |
| Central African Republic | 529 | 14.55 |
| Malaysia | 567 | 0.83 |
| Zimbabwe | 576 | 5.01 |
| Chad | 591 | 13.58 |
| Albania | 597 | 1.71 |
| Marshall Islands | 610 | -% |
| Malta | 620 | -% |
| Japan | 641 | 0.24 |
| Fiji | 705 | 1.65 |
| United States of America | 725 | 0.16 |
| Panama | 730 | 0.66 |
| Spain | 736 | 0.34 |
| Cambodia | 746 | 7.55 |
| Finland | 797 | 0.23 |
| Yemen | 808 | 10.7 |
| Kuwait | 814 | 0.31 |
| Guatemala | 819 | 2.63 |
| Bosnia and Herzegovina | 833 | 1.93 |
| Seychelles | 842 | 0.75 |
| Jordan | 860 | 2.67 |
| Somalia | 900 | -% |
| Haiti | 941 | 14.03 |
| Gabon | 947 | 2.18 |
| Nicaragua | 948 | 6.6 |
| El Salvador | 975 | 3.53 |
| Dominica | 1073 | 2.31 |
| Iceland | 1089 | 0.23 |
| Barbados | 1159 | 0.92 |
| Congo (Republic of the) | 1229 | 25.46 |
| Israel | 1241 | 0.41 |
| Saudi Arabia | 1267 | 0.81 |
| Antigua and Barbuda | 1271 | -% |
| Bolivia | 1293 | 5.67 |
| Luxembourg | 1343 | 0.27 |
| Uruguay | 1344 | 1.13 |
| Syria | 1392 | 10.41 |
| Grenada | 1410 | -% |
| Mexico | 1450 | 2.34 |
| Switzerland | 1463 | 0.27 |
| Norway | 1482 | 0.27 |
| Iraq | 1573 | 4.34 |
| Cyprus | 1576 | 0.72 |
| Liechtenstein | 1619 | -% |
| Ecuador | 1630 | 4.23 |
| Bahamas | 1810 | 0.89 |
| Netherlands | 2190 | 0.59 |
| Equatorial Guinea | 2322 | 7.18 |
| Belgium | 2402 | 0.74 |
| Austria | 2475 | 0.71 |
| Lebanon | 2855 | 5.35 |
| Suriname | 3030 | 11.14 |
| Qatar | 3952 | 0.92 |
| San Marino | 4672 | -% |
| Italy | 4876 | 2.02 |
| United Arab Emirates | 7444 | 2.23 |
At a glance, the cheapest regions for starting a business include Central Asia and Africa.
But the cheapest countries on the dollar for a new startup are Venezuela, Rwanda, and Slovenia. While the former does have fees that only total $0.21, both Rwanda and Slovenia have no fees for new businesses, though Slovenia does have a capital requirement of €7,500.
Expensive countries for new businesses are also spread across the world. There are some in Europe, including Italy at $4,876 and Austria at $2,475, as well as the Americas, including Suriname at $3,030 and Ecuador at $1,630.
The most expensive countries, however, are largely in the Middle East. They include #1 UAE at $7,444, #4 Qatar at $3,952, and #6 Lebanon at $2,855.
Which Country is the Most Affordable for Starting a Business?
Just as costs vary by country, so too does relative affordability.
Though some countries are cheaper than others for starting a business on the dollar, the picture changes when accounting for monthly income. When it comes to the cost of starting a business relative to monthly income, many developed countries take the cake.
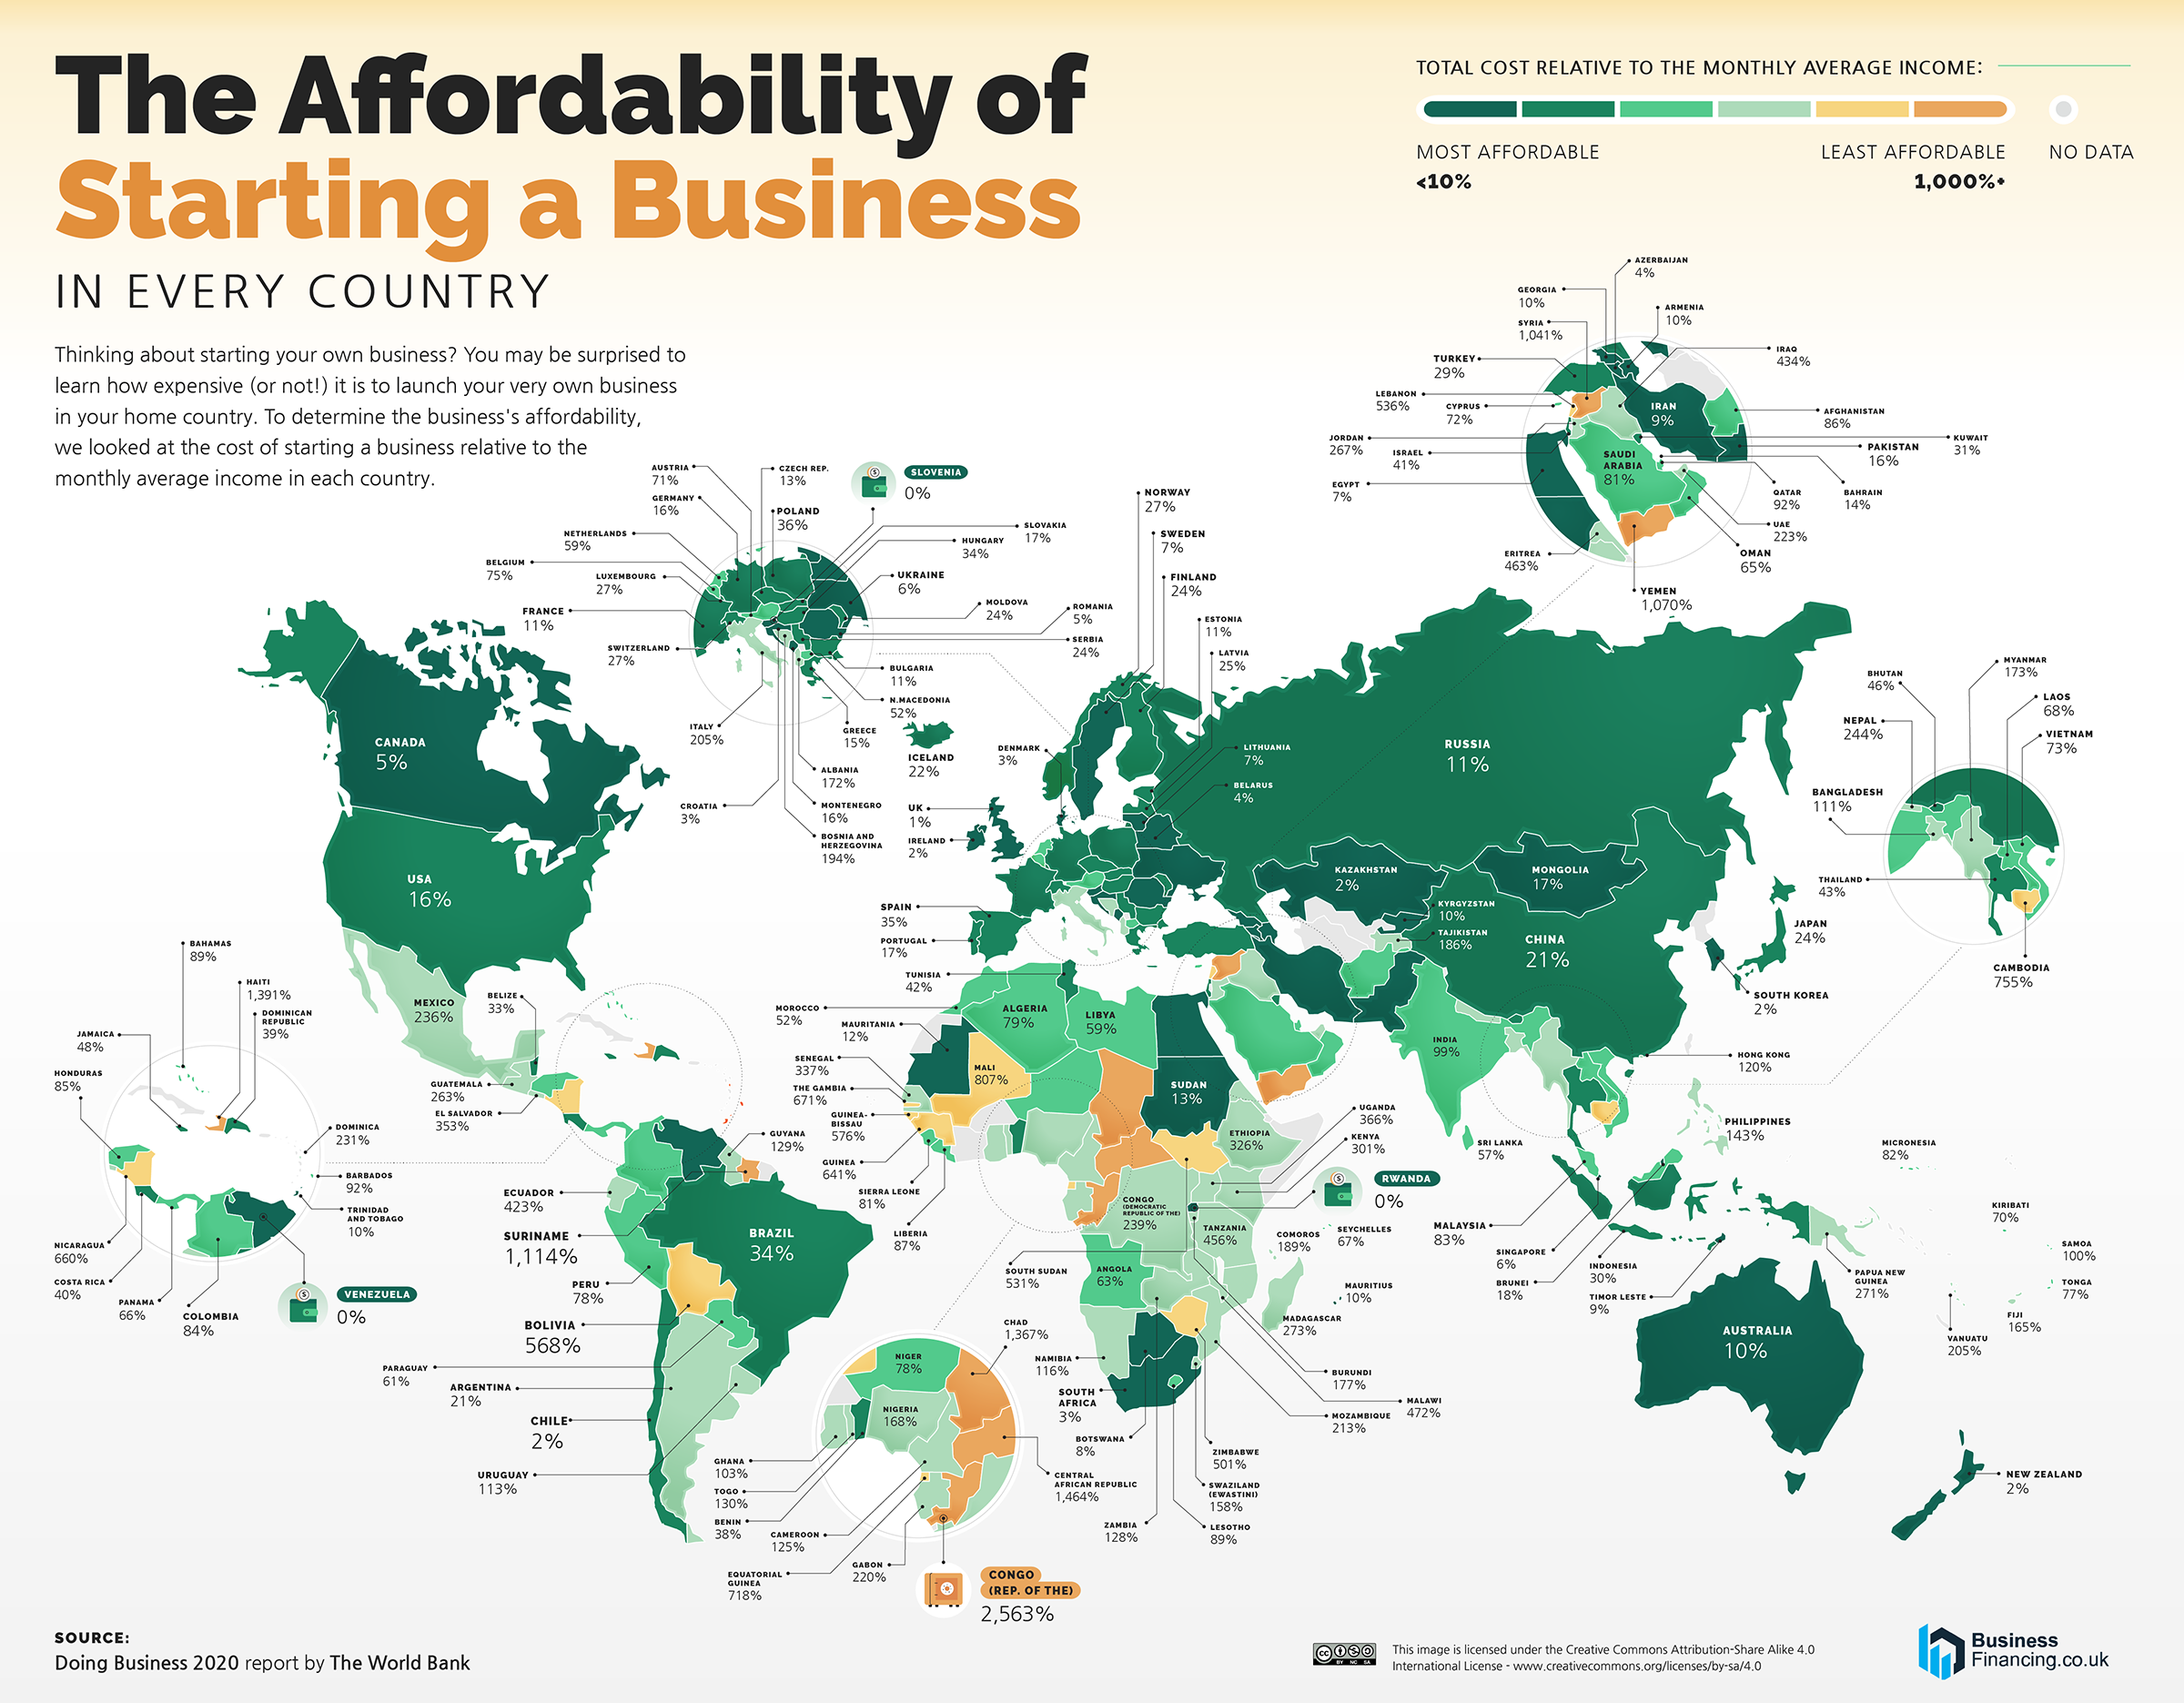
Not including countries with missing data, the most affordable countries for starting a business include the UK, Denmark, and Ireland in Europe, South Korea in East Asia, and New Zealand in Oceania. Startup costs in each range from just 1%-2% of monthly income.
The picture is similar in the Americas, where Chile and Canada have the lowest relative fees at 2% and 5% of monthly income respectively. Even the U.S.—which has a decently high cost of $725 for starting a business—is relatively affordable at 16% of monthly income.
Some of the least affordable countries lie in the Middle-East and Central America. Haiti and Suriname have startup costs that are 1,403% and 1,114% of monthly income, while Yemen has affordability rates of 1,070%.
But the least affordable countries are in Africa. Many countries on the continent have startup costs that are more than 100% of monthly income, but the Republic of the Congo and the Central African Republic have affordability rates of 2,546% and 1,455% of monthly income, respectively.
Where is the best place to start a business? It can depend on the barrier to entry. But the biggest barrier takes time and ingenuity: finding the right idea at the right time.


Copper
Brass Rods: The Secure Choice
This graphic shows why brass rods are the secure choice for precision-machined and forged parts.


Brass Rods: The Secure Choice
The unique combination of machinability and recyclability makes brass rods the secure choice for manufacturers seeking future-proof raw material solutions.
This infographic, from the Copper Development Association, shows three ways brass rods give manufacturers greater control and a license to grow in the competitive market for precision-machined and forged products.
Future-Proof Investments in New Machine Tools
A material’s machinability directly impacts machine throughput, which typically has the largest impact on machine shop profitability.
The high-speed machining capabilities of brass rods maximize machine tool performance, allowing manufacturers to run the material faster and longer without sacrificing tool life, chip formation, or surface quality.
The high machining efficiency of brass leads to reduced per-part costs, quicker return on investment (ROI) for new machine tools, and expanded production capacity for new projects.
Supply Security Through Closed Loop Recycling
Brass, like its parent element copper, can be infinitely recycled.
In 2022, brass- and wire-rod mills accounted for the majority of the 830,000 tonnes of copper recycled from scrap in the United States.
Given that scrap ratios for machined parts typically range from 60-70% by weight, producing mills benefit from a secure and steady supply of clean scrap returned directly from customers, which is recycled to create new brass rods.
The high residual value of brass scrap creates a strong recycling incentive. Scrap buy back programs give manufacturers greater control over raw material net costs as scrap value is often factored into supplier purchase agreements.
Next Generation Alloys for a Lead-Free Future
Increasingly stringent global regulations continue to pressure manufacturers to minimize the use of materials containing trace amounts of lead and other harmful impurities.
The latest generation of brass-rod alloys is engineered to meet the most demanding criteria for lead leaching in drinking water and other sensitive applications.
Seven brass-rod alloys passed rigorous testing to become the only ‘Acceptable Materials’ against lower lead leaching criteria recently adopted in the national U.S. drinking water quality standard, NSF 61.
Learn more about the advantages of brass rods solutions.

-

 Base Metals1 year ago
Ranked: The World’s Largest Copper Producers
Many new technologies critical to the energy transition rely on copper. Here are the world’s largest copper producers.
-

 Silver2 years ago
Mapped: Solar Power by Country in 2021
In 2020, solar power saw its largest-ever annual capacity expansion at 127 gigawatts. Here’s a snapshot of solar power capacity by country.
-

 Batteries5 years ago
Visualizing Copper’s Role in the Transition to Clean Energy
A clean energy transition is underway as wind, solar, and batteries take center stage. Here’s how copper plays the critical role in these technologies.
-

 Science5 years ago
Everything You Need to Know on VMS Deposits
Deep below the ocean’s waves, VMS deposits spew out massive amounts of minerals like copper, zinc, and gold, making them a key source of the metals…
-
 Copper5 years ago
How Much Copper is in an Electric Vehicle?
Have you ever wondered how much copper is in an electric vehicle? This infographic shows the metal’s properties as well as the quantity of copper used.
-
 Copper6 years ago
Copper: Driving the Green Energy Revolution
Renewable energy is set to fuel a new era of copper demand – here’s how much copper is used in green applications from EVs to photovoltaics.

-

 Real Estate2 weeks ago
Visualizing America’s Shortage of Affordable Homes
-

 Technology1 week ago
Ranked: Semiconductor Companies by Industry Revenue Share
-

 Money1 week ago
Which States Have the Highest Minimum Wage in America?
-

 Real Estate1 week ago
Ranked: The Most Valuable Housing Markets in America
-

 Business2 weeks ago
Charted: Big Four Market Share by S&P 500 Audits
-

 AI2 weeks ago
The Stock Performance of U.S. Chipmakers So Far in 2024
-

 Misc2 weeks ago
Almost Every EV Stock is Down After Q1 2024
-

 Money2 weeks ago
Where Does One U.S. Tax Dollar Go?