Economy
Which Country is the Cheapest for Starting a Business?
View the full-size infographic map
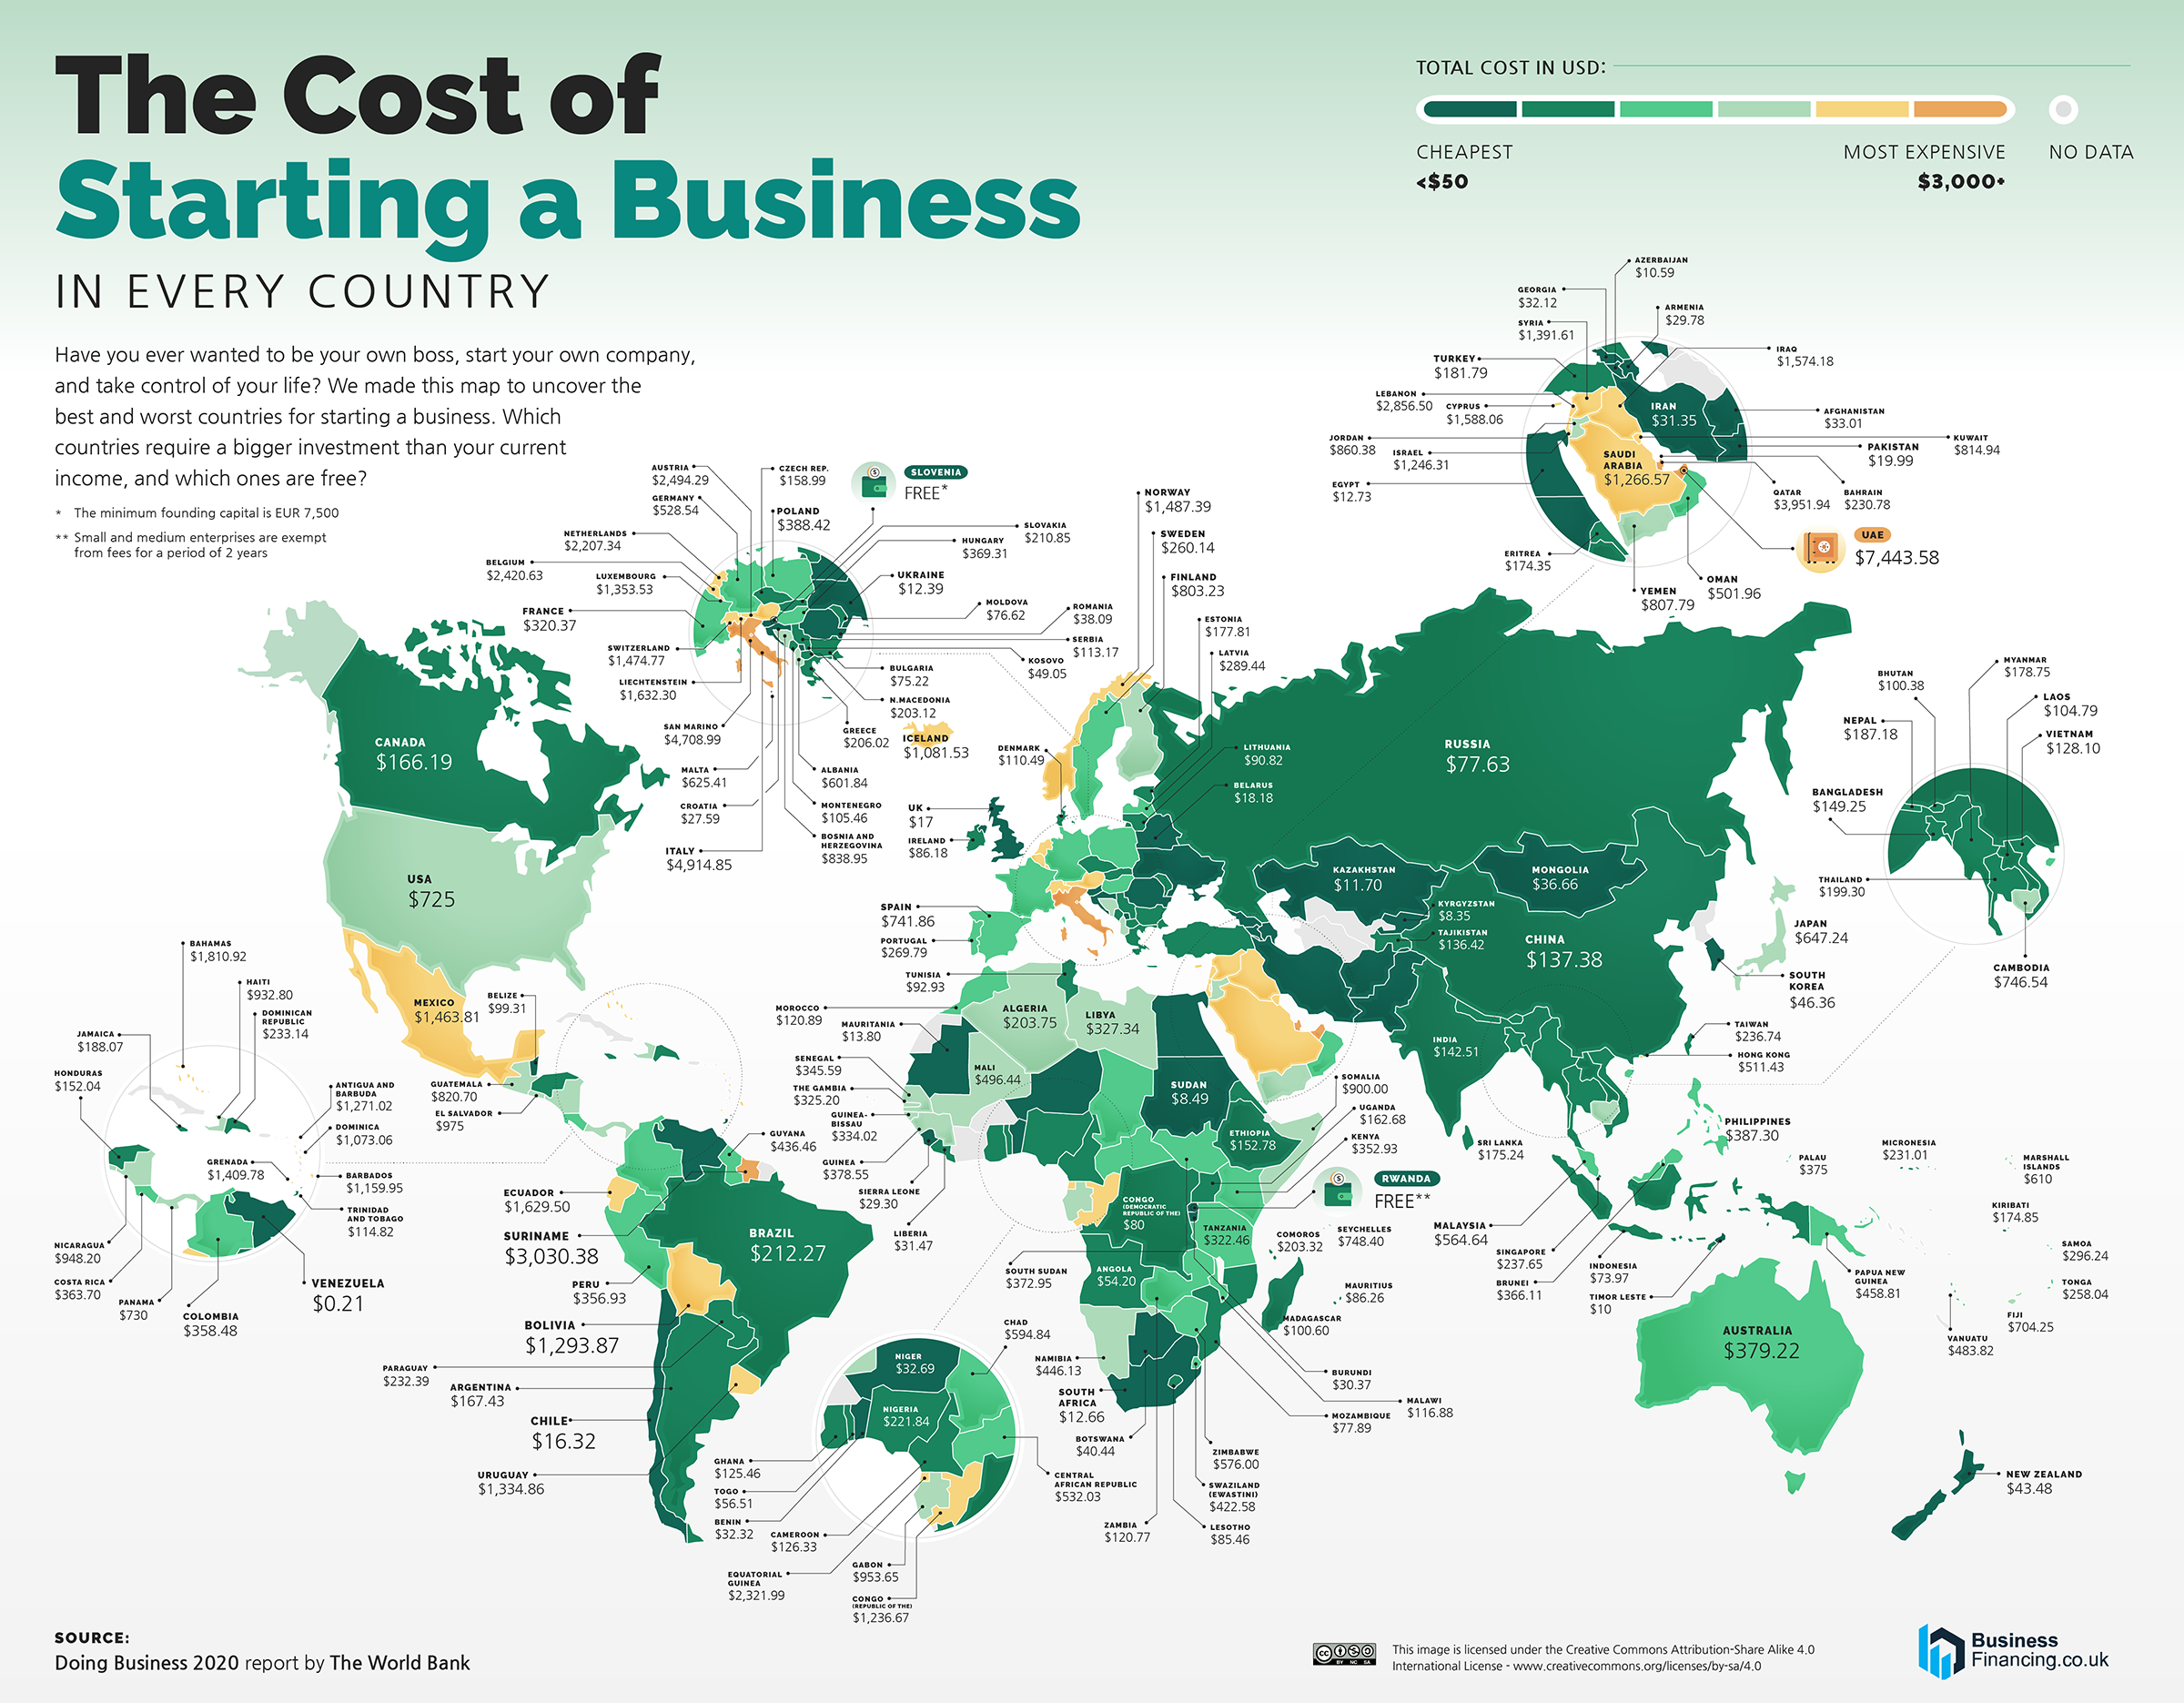
Which Country is the Cheapest for Starting A Business?
Starting a new business isn’t as simple as coming up with an idea.
In addition to the time investment needed to formulate and create a business, there’s often a hefty capital requirement. A new business usually requires paying different fees for licensing, permits, and approvals, and many governments also have minimum on-hand capital requirements.
And costs are relative. Though it might be more costly to start a business in some countries on paper, affordability also takes into account relative income.
These graphics from BusinessFinancing.co.uk use data from the World Bank’s Doing Business 2020 report to examine the startup cost for a small-to-medium-size LLC in the largest business cities across 190 countries.
The Cost of Starting a Business in Different Countries
From a pure cost perspective, the affordability of starting a business is extremely dependent on where you are located.
Some countries make the cost of business extremely low to encourage more economic activity. Others have high or nearly inaccessible fees to protect existing businesses, or to simply cash in on the entrepreneurial spirit.
| Country | Cost (2020 USD) | % of Monthly Income |
|---|---|---|
| Venezuela | 0 | -% |
| Rwanda | 0 | -% |
| Slovenia | 0 | -% |
| Kyrgyzstan | 8 | 0.1 |
| Sudan | 8 | 0.13 |
| Timor Leste | 10 | 0.09 |
| Azerbaijan | 11 | 0.04 |
| Kazakhstan | 12 | 0.02 |
| Ukraine | 12 | 0.06 |
| Egypt | 13 | 0.07 |
| South Africa | 13 | 0.03 |
| Mauritania | 14 | 0.12 |
| Uzbekistan | 14 | 0.13 |
| Chile | 16 | 0.02 |
| United Kingdom | 17 | 0.01 |
| Belarus | 18 | 0.04 |
| Pakistan | 20 | 0.16 |
| Croatia | 27 | 0.03 |
| Sierra Leone | 29 | 0.81 |
| Armenia | 30 | 0.1 |
| Burundi | 30 | 1.77 |
| Iran | 31 | 0.09 |
| Benin | 32 | 0.38 |
| Liberia | 32 | 0.87 |
| Niger | 32 | 0.78 |
| Afghanistan | 33 | 0.86 |
| Georgia | 33 | 0.1 |
| Mongolia | 37 | 0.17 |
| Romania | 38 | 0.05 |
| Botswana | 40 | 0.08 |
| New Zealand | 43 | 0.02 |
| South Korea | 47 | 0.02 |
| Kosovo | 49 | -% |
| Angola | 54 | 0.63 |
| Togo | 56 | 1.29 |
| Indonesia | 74 | 0.3 |
| Bulgaria | 75 | 0.11 |
| Moldova | 76 | 0.24 |
| Mozambique | 76 | 2.09 |
| Russia | 77 | 0.11 |
| Congo (Democratic Republic of the) | 80 | 2.39 |
| Ireland | 86 | 0.02 |
| Lesotho | 86 | 0.89 |
| Mauritius | 86 | 0.1 |
| Lithuania | 90 | 0.07 |
| Tunisia | 93 | 0.42 |
| Belize | 99 | 0.33 |
| Bhutan | 100 | 0.45 |
| Madagascar | 100 | 2.72 |
| Laos | 105 | 0.68 |
| Montenegro | 105 | 0.16 |
| Denmark | 110 | 0.02 |
| Serbia | 112 | 0.24 |
| Trinidad and Tobago | 115 | 0.1 |
| Malawi | 117 | 4.72 |
| Morocco | 120 | 0.52 |
| Zambia | 120 | 1.28 |
| Cameroon | 125 | 1.24 |
| Ghana | 125 | 1.03 |
| Vietnam | 128 | 0.73 |
| Tajikistan | 136 | 1.86 |
| China | 138 | 0.21 |
| India | 142 | 0.98 |
| Bangladesh | 149 | 1.11 |
| Ethiopia | 150 | 3.21 |
| Honduras | 152 | 0.85 |
| Czech Republic | 158 | 0.13 |
| Uganda | 163 | 3.67 |
| Canada | 165 | 0.05 |
| Argentina | 167 | 0.21 |
| Eritrea | 174 | 4.63 |
| Kiribati | 174 | 0.7 |
| Estonia | 176 | 0.11 |
| Sri Lanka | 176 | 0.56 |
| Turkey | 177 | 0.28 |
| Myanmar | 179 | 1.73 |
| Nepal | 186 | 2.43 |
| Jamaica | 189 | 0.48 |
| Thailand | 201 | 0.43 |
| North Macedonia | 202 | 0.52 |
| Algeria | 203 | 0.79 |
| Comoros | 204 | 1.9 |
| Greece | 204 | 0.14 |
| Slovakia | 209 | 0.17 |
| Brazil | 218 | 0.35 |
| Nigeria | 223 | 1.68 |
| Bahrain | 231 | 0.14 |
| Micronesia, Federated States of | 231 | 0.82 |
| Paraguay | 232 | 0.61 |
| Dominican Republic | 233 | 0.39 |
| Singapore | 238 | 0.06 |
| Taiwan | 239 | -% |
| Sweden | 259 | 0.07 |
| Tonga | 262 | 0.78 |
| Portugal | 268 | 0.17 |
| Latvia | 287 | 0.25 |
| Samoa | 296 | 1 |
| France | 318 | 0.11 |
| Tanzania | 322 | 4.55 |
| The Gambia | 326 | 6.71 |
| Libya | 328 | 0.59 |
| Guinea-Bissau | 332 | 5.72 |
| Senegal | 343 | 3.35 |
| Kenya | 353 | 3.01 |
| Peru | 355 | 0.77 |
| Costa Rica | 363 | 0.4 |
| Colombia | 364 | 0.85 |
| Brunei | 366 | 0.18 |
| Hungary | 369 | 0.34 |
| South Sudan | 373 | 5.31 |
| Palau | 375 | -% |
| Australia | 377 | 0.1 |
| Guinea | 380 | 6.42 |
| Poland | 387 | 0.36 |
| Philippines | 389 | 1.44 |
| Swaziland (Eswatini) | 425 | 1.59 |
| Guyana | 436 | 1.29 |
| Namibia | 446 | 1.15 |
| Papua New Guinea | 459 | 2.71 |
| Vanuatu | 484 | 2.04 |
| Mali | 493 | 8.02 |
| Oman | 502 | 0.65 |
| Hong Kong | 512 | 1.2 |
| Germany | 524 | 0.16 |
| Central African Republic | 529 | 14.55 |
| Malaysia | 567 | 0.83 |
| Zimbabwe | 576 | 5.01 |
| Chad | 591 | 13.58 |
| Albania | 597 | 1.71 |
| Marshall Islands | 610 | -% |
| Malta | 620 | -% |
| Japan | 641 | 0.24 |
| Fiji | 705 | 1.65 |
| United States of America | 725 | 0.16 |
| Panama | 730 | 0.66 |
| Spain | 736 | 0.34 |
| Cambodia | 746 | 7.55 |
| Finland | 797 | 0.23 |
| Yemen | 808 | 10.7 |
| Kuwait | 814 | 0.31 |
| Guatemala | 819 | 2.63 |
| Bosnia and Herzegovina | 833 | 1.93 |
| Seychelles | 842 | 0.75 |
| Jordan | 860 | 2.67 |
| Somalia | 900 | -% |
| Haiti | 941 | 14.03 |
| Gabon | 947 | 2.18 |
| Nicaragua | 948 | 6.6 |
| El Salvador | 975 | 3.53 |
| Dominica | 1073 | 2.31 |
| Iceland | 1089 | 0.23 |
| Barbados | 1159 | 0.92 |
| Congo (Republic of the) | 1229 | 25.46 |
| Israel | 1241 | 0.41 |
| Saudi Arabia | 1267 | 0.81 |
| Antigua and Barbuda | 1271 | -% |
| Bolivia | 1293 | 5.67 |
| Luxembourg | 1343 | 0.27 |
| Uruguay | 1344 | 1.13 |
| Syria | 1392 | 10.41 |
| Grenada | 1410 | -% |
| Mexico | 1450 | 2.34 |
| Switzerland | 1463 | 0.27 |
| Norway | 1482 | 0.27 |
| Iraq | 1573 | 4.34 |
| Cyprus | 1576 | 0.72 |
| Liechtenstein | 1619 | -% |
| Ecuador | 1630 | 4.23 |
| Bahamas | 1810 | 0.89 |
| Netherlands | 2190 | 0.59 |
| Equatorial Guinea | 2322 | 7.18 |
| Belgium | 2402 | 0.74 |
| Austria | 2475 | 0.71 |
| Lebanon | 2855 | 5.35 |
| Suriname | 3030 | 11.14 |
| Qatar | 3952 | 0.92 |
| San Marino | 4672 | -% |
| Italy | 4876 | 2.02 |
| United Arab Emirates | 7444 | 2.23 |
At a glance, the cheapest regions for starting a business include Central Asia and Africa.
But the cheapest countries on the dollar for a new startup are Venezuela, Rwanda, and Slovenia. While the former does have fees that only total $0.21, both Rwanda and Slovenia have no fees for new businesses, though Slovenia does have a capital requirement of €7,500.
Expensive countries for new businesses are also spread across the world. There are some in Europe, including Italy at $4,876 and Austria at $2,475, as well as the Americas, including Suriname at $3,030 and Ecuador at $1,630.
The most expensive countries, however, are largely in the Middle East. They include #1 UAE at $7,444, #4 Qatar at $3,952, and #6 Lebanon at $2,855.
Which Country is the Most Affordable for Starting a Business?
Just as costs vary by country, so too does relative affordability.
Though some countries are cheaper than others for starting a business on the dollar, the picture changes when accounting for monthly income. When it comes to the cost of starting a business relative to monthly income, many developed countries take the cake.
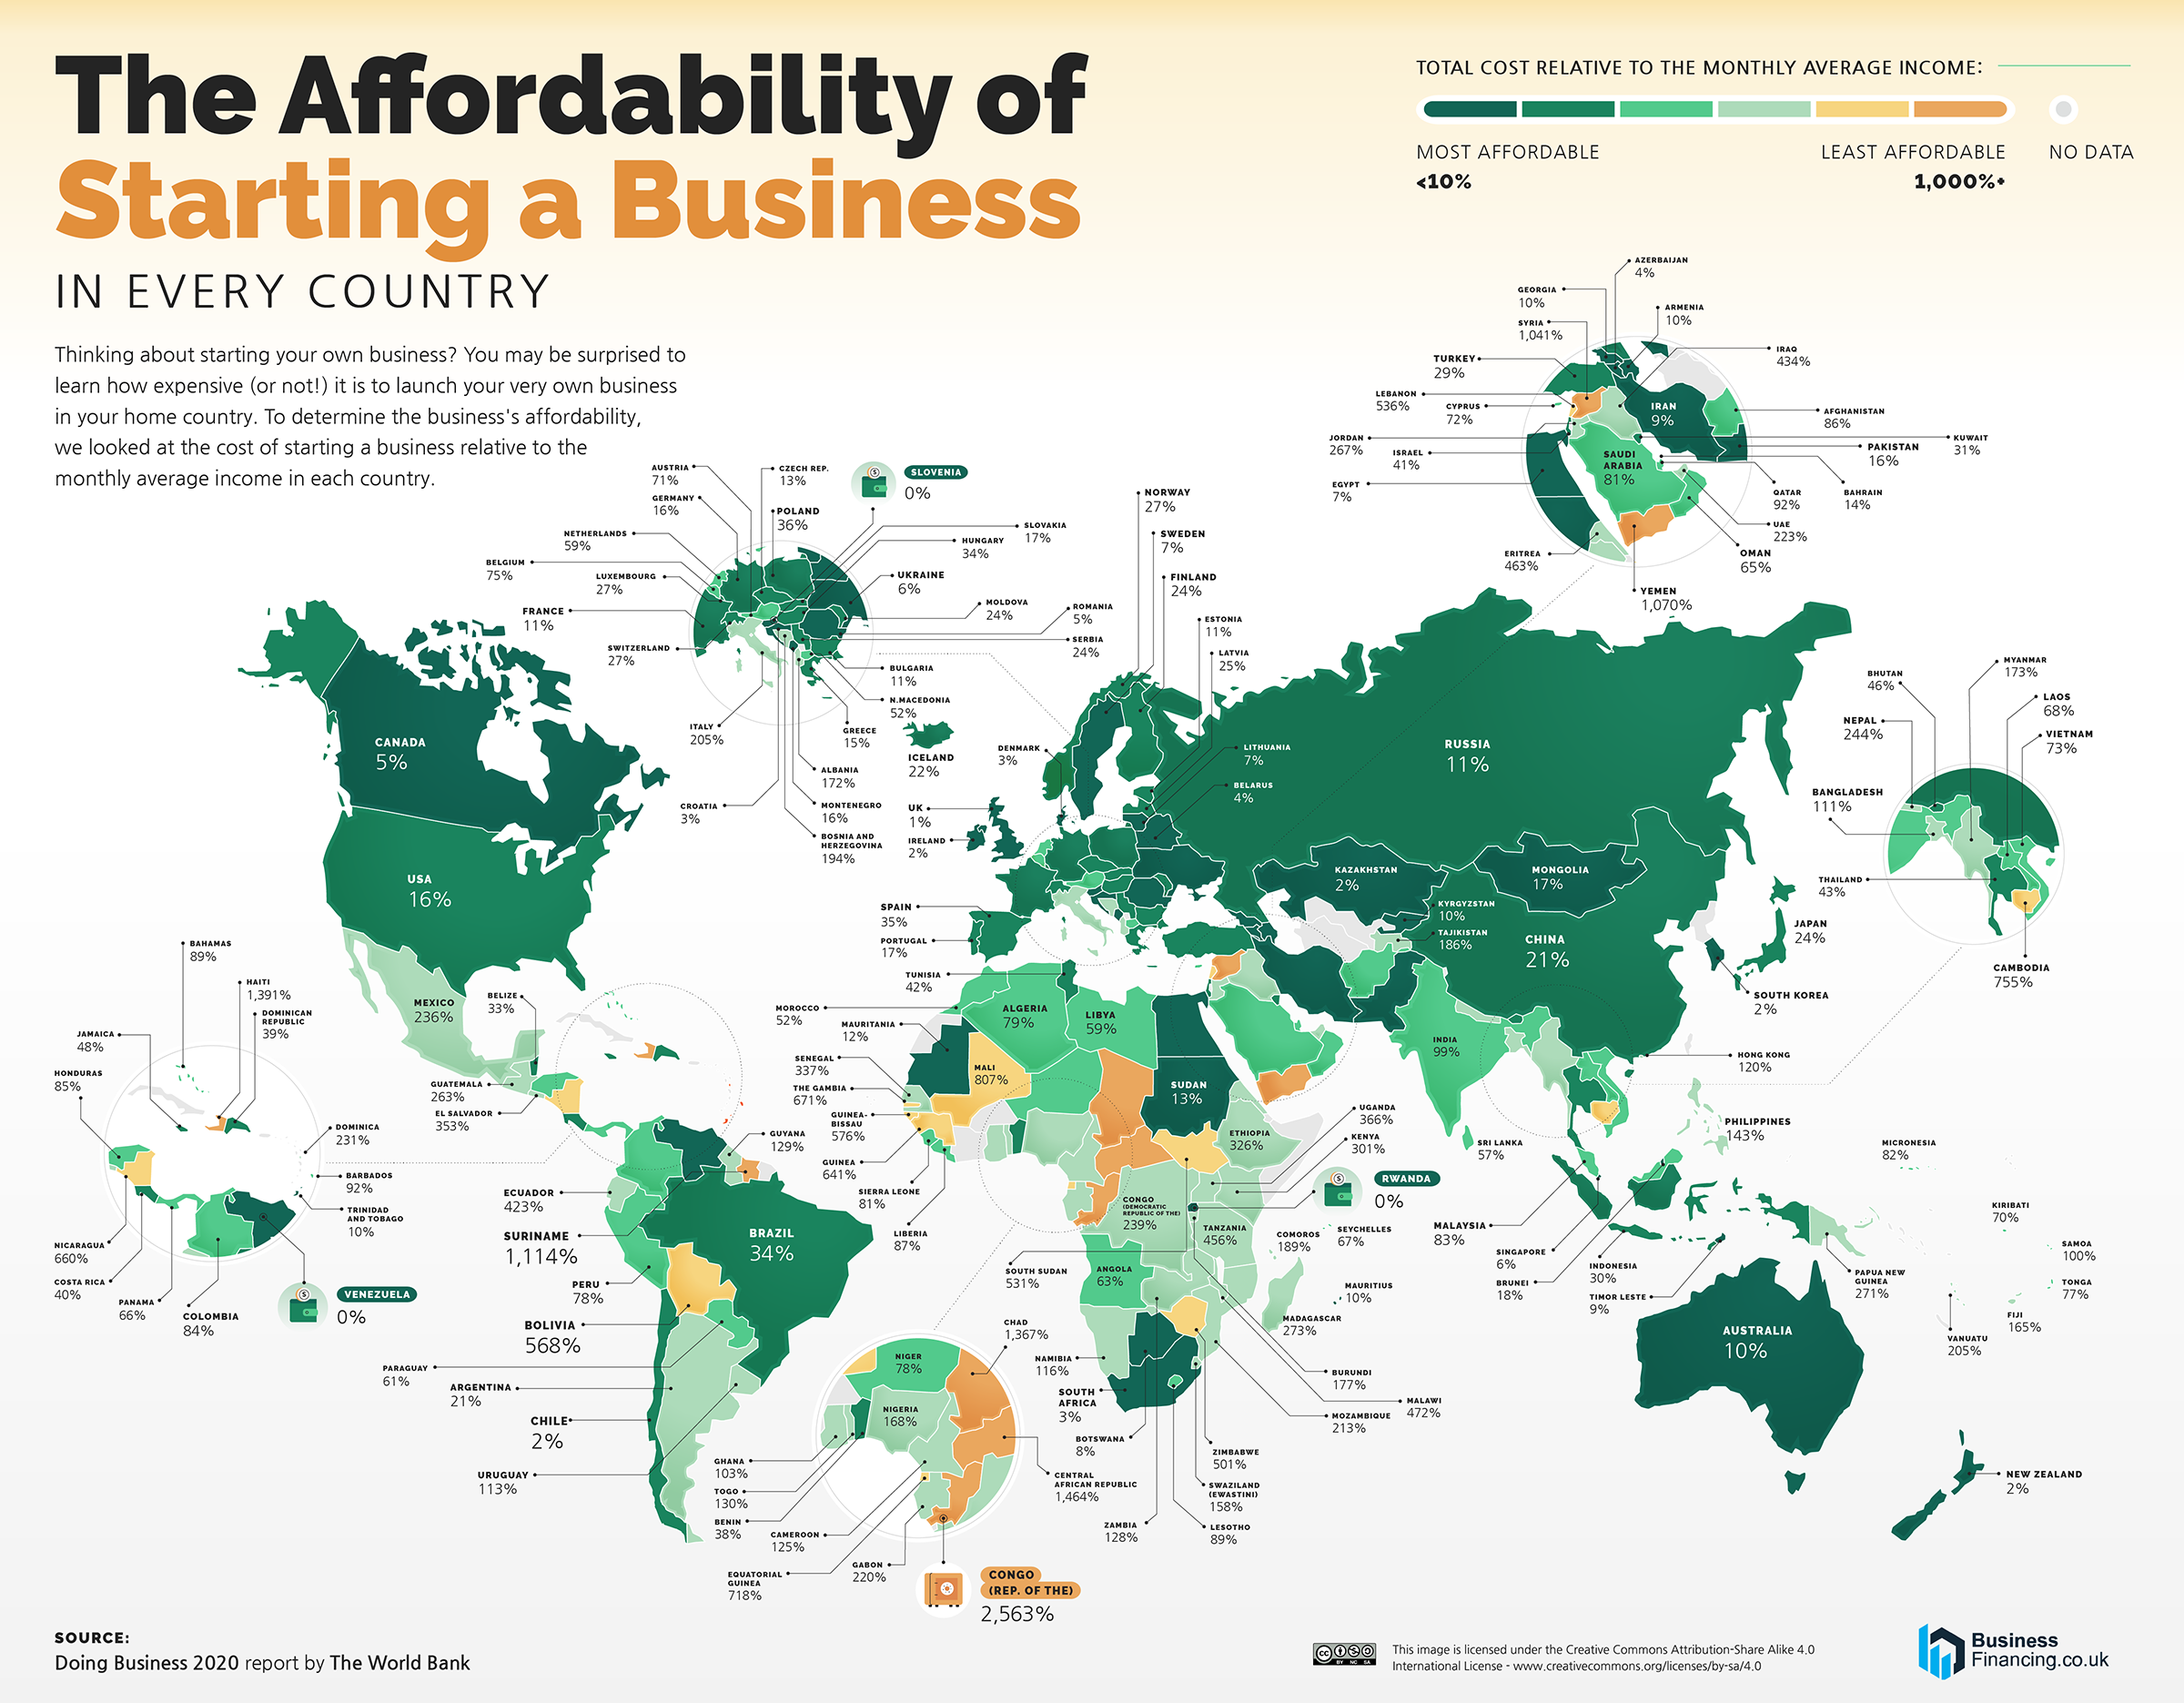
Not including countries with missing data, the most affordable countries for starting a business include the UK, Denmark, and Ireland in Europe, South Korea in East Asia, and New Zealand in Oceania. Startup costs in each range from just 1%-2% of monthly income.
The picture is similar in the Americas, where Chile and Canada have the lowest relative fees at 2% and 5% of monthly income respectively. Even the U.S.—which has a decently high cost of $725 for starting a business—is relatively affordable at 16% of monthly income.
Some of the least affordable countries lie in the Middle-East and Central America. Haiti and Suriname have startup costs that are 1,403% and 1,114% of monthly income, while Yemen has affordability rates of 1,070%.
But the least affordable countries are in Africa. Many countries on the continent have startup costs that are more than 100% of monthly income, but the Republic of the Congo and the Central African Republic have affordability rates of 2,546% and 1,455% of monthly income, respectively.
Where is the best place to start a business? It can depend on the barrier to entry. But the biggest barrier takes time and ingenuity: finding the right idea at the right time.


Economy
Economic Growth Forecasts for G7 and BRICS Countries in 2024
The IMF has released its economic growth forecasts for 2024. How do the G7 and BRICS countries compare?


G7 & BRICS Real GDP Growth Forecasts for 2024
The International Monetary Fund’s (IMF) has released its real gross domestic product (GDP) growth forecasts for 2024, and while global growth is projected to stay steady at 3.2%, various major nations are seeing declining forecasts.
This chart visualizes the 2024 real GDP growth forecasts using data from the IMF’s 2024 World Economic Outlook for G7 and BRICS member nations along with Saudi Arabia, which is still considering an invitation to join the bloc.
Get the Key Insights of the IMF’s World Economic Outlook
Want a visual breakdown of the insights from the IMF’s 2024 World Economic Outlook report?
This visual is part of a special dispatch of the key takeaways exclusively for VC+ members.
Get the full dispatch of charts by signing up to VC+.
Mixed Economic Growth Prospects for Major Nations in 2024
Economic growth projections by the IMF for major nations are mixed, with the majority of G7 and BRICS countries forecasted to have slower growth in 2024 compared to 2023.
Only three BRICS-invited or member countries, Saudi Arabia, the UAE, and South Africa, have higher projected real GDP growth rates in 2024 than last year.
| Group | Country | Real GDP Growth (2023) | Real GDP Growth (2024P) |
|---|---|---|---|
| G7 | 🇺🇸 U.S. | 2.5% | 2.7% |
| G7 | 🇨🇦 Canada | 1.1% | 1.2% |
| G7 | 🇯🇵 Japan | 1.9% | 0.9% |
| G7 | 🇫🇷 France | 0.9% | 0.7% |
| G7 | 🇮🇹 Italy | 0.9% | 0.7% |
| G7 | 🇬🇧 UK | 0.1% | 0.5% |
| G7 | 🇩🇪 Germany | -0.3% | 0.2% |
| BRICS | 🇮🇳 India | 7.8% | 6.8% |
| BRICS | 🇨🇳 China | 5.2% | 4.6% |
| BRICS | 🇦🇪 UAE | 3.4% | 3.5% |
| BRICS | 🇮🇷 Iran | 4.7% | 3.3% |
| BRICS | 🇷🇺 Russia | 3.6% | 3.2% |
| BRICS | 🇪🇬 Egypt | 3.8% | 3.0% |
| BRICS-invited | 🇸🇦 Saudi Arabia | -0.8% | 2.6% |
| BRICS | 🇧🇷 Brazil | 2.9% | 2.2% |
| BRICS | 🇿🇦 South Africa | 0.6% | 0.9% |
| BRICS | 🇪🇹 Ethiopia | 7.2% | 6.2% |
| 🌍 World | 3.2% | 3.2% |
China and India are forecasted to maintain relatively high growth rates in 2024 at 4.6% and 6.8% respectively, but compared to the previous year, China is growing 0.6 percentage points slower while India is an entire percentage point slower.
On the other hand, four G7 nations are set to grow faster than last year, which includes Germany making its comeback from its negative real GDP growth of -0.3% in 2023.
Faster Growth for BRICS than G7 Nations
Despite mostly lower growth forecasts in 2024 compared to 2023, BRICS nations still have a significantly higher average growth forecast at 3.6% compared to the G7 average of 1%.
While the G7 countries’ combined GDP is around $15 trillion greater than the BRICS nations, with continued higher growth rates and the potential to add more members, BRICS looks likely to overtake the G7 in economic size within two decades.
BRICS Expansion Stutters Before October 2024 Summit
BRICS’ recent expansion has stuttered slightly, as Argentina’s newly-elected president Javier Milei declined its invitation and Saudi Arabia clarified that the country is still considering its invitation and has not joined BRICS yet.
Even with these initial growing pains, South Africa’s Foreign Minister Naledi Pandor told reporters in February that 34 different countries have submitted applications to join the growing BRICS bloc.
Any changes to the group are likely to be announced leading up to or at the 2024 BRICS summit which takes place October 22-24 in Kazan, Russia.
Get the Full Analysis of the IMF’s Outlook on VC+
This visual is part of an exclusive special dispatch for VC+ members which breaks down the key takeaways from the IMF’s 2024 World Economic Outlook.
For the full set of charts and analysis, sign up for VC+.

-

 Markets1 week ago
U.S. Debt Interest Payments Reach $1 Trillion
-

 Markets2 weeks ago
Ranked: The Most Valuable Housing Markets in America
-

 Money2 weeks ago
Which States Have the Highest Minimum Wage in America?
-

 AI2 weeks ago
Ranked: Semiconductor Companies by Industry Revenue Share
-

 Markets2 weeks ago
Ranked: The World’s Top Flight Routes, by Revenue
-

 Countries2 weeks ago
Population Projections: The World’s 6 Largest Countries in 2075
-

 Markets2 weeks ago
The Top 10 States by Real GDP Growth in 2023
-

 Money2 weeks ago
The Smallest Gender Wage Gaps in OECD Countries