Energy
Which Countries Produce the Most Natural Gas?
![]() Subscribe to the Elements free mailing list for more like this
Subscribe to the Elements free mailing list for more like this


Which Countries Produce the Most Natural Gas?
This was originally posted on Elements. Sign up to the free mailing list to get beautiful visualizations on natural resource megatrends in your email every week.
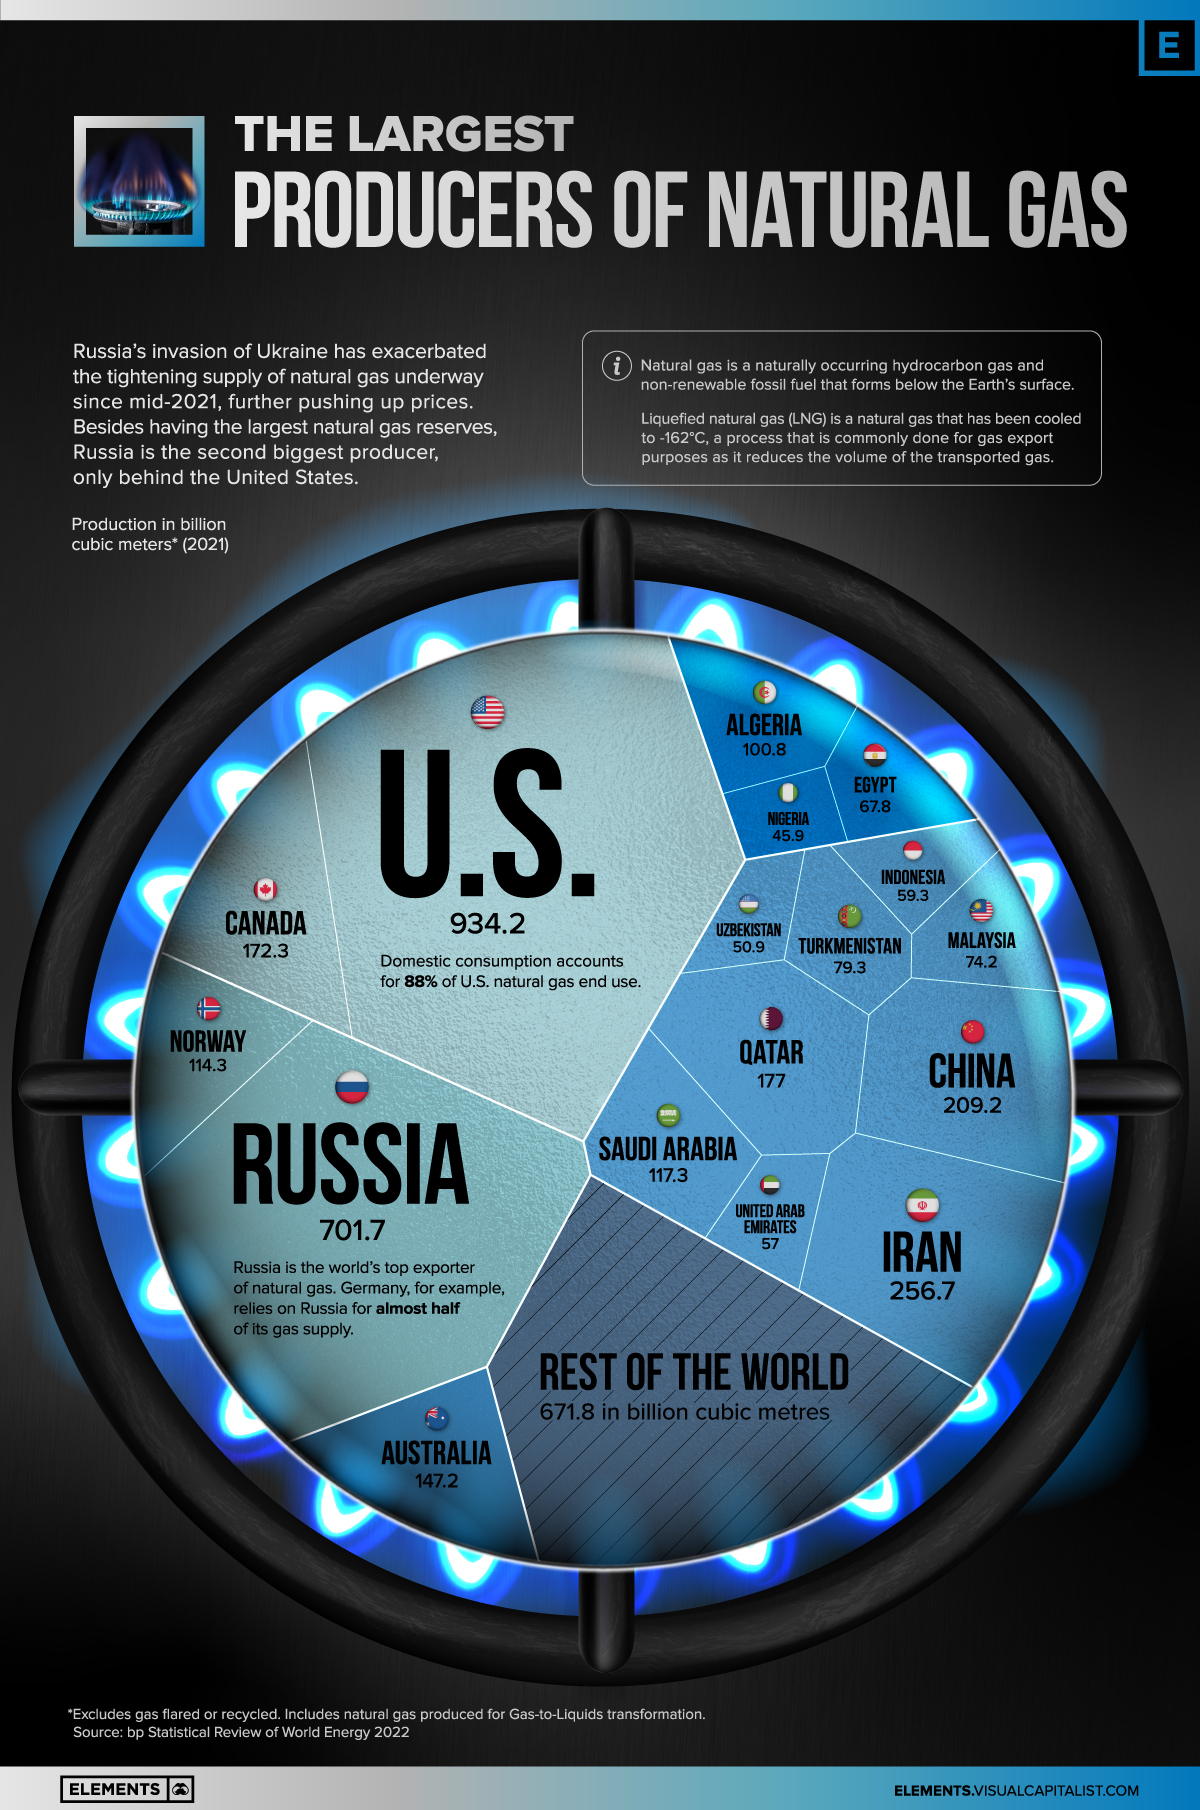
Natural gas prices have risen since Russia’s invasion of Ukraine, exacerbating an already tight supply situation.
Making matters worse, Moscow has since cut gas exports to Europe to multi-year lows, sending Europe’s gas price to almost 10 times its pre-war average.
Using data from BP’s Statistical Review of World Energy, the above infographic provides further context on the gas market by visualizing the world’s largest gas producers in 2021.
Natural Gas Consumption at All-Time High in 2021
Natural gas is part of nearly every aspect of our daily lives. It is used for heating, cooking, electricity generation, as fuel for motor vehicles, in fertilizers, and in the manufacture of plastics.
The fuel is a naturally occurring hydrocarbon gas and non-renewable fossil fuel that forms below the Earth’s surface. Although the Earth has enormous quantities of natural gas, much of it is in areas far from where the fuel is needed. To facilitate transport and reduce volume, natural gas is frequently converted into liquefied natural gas (LNG), in a process called liquefaction.
Despite global efforts to reduce reliance on fossil fuels, natural gas consumption reached a new all-time high in 2021, surpassing the previous record set in 2019 by 3.3%.
Demand is expected to decline slightly in 2022 and remain subdued up to 2025, according to the International Energy Agency.
| Region | 2021 Demand in Billion Cubic Meters (bcm) | 2022P (bcm) | 2025P (bcm) |
|---|---|---|---|
| Africa | 169 | 172 | 188 |
| Asia Pacific | 895 | 907 | 990 |
| Central and South America | 153 | 147 | 153 |
| Eurasia | 634 | 619 | 632 |
| Europe | 604 | 549 | 536 |
| Middle East | 564 | 582 | 627 |
| North America | 1,084 | 1,108 | 1,116 |
| World | 4,103 | 4,083 | 4,243 |
The Asia Pacific region and the industrial sector are expected to be the main drivers of global gas consumption in the coming years
Natural Gas Production, by Country
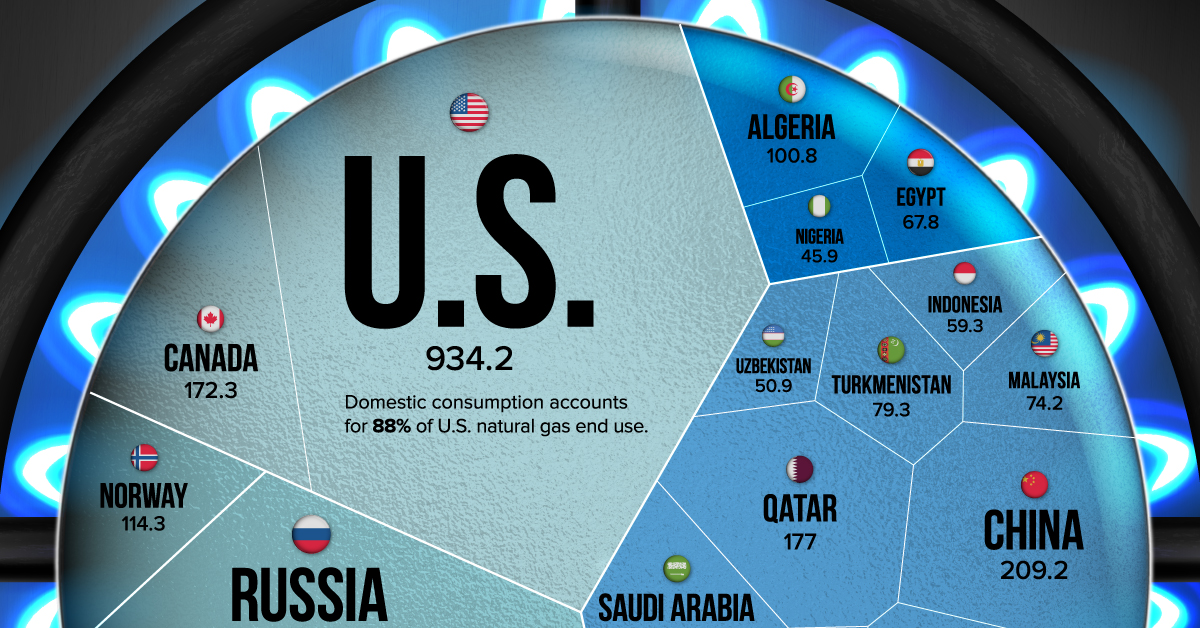
The world’s top 10 producers of natural gas account for about 73% of total production.
| Rank | Country | 2021 Production (bcm) | Share % |
|---|---|---|---|
| #1 | 🇺🇸 United States | 934.2 | 23.1% |
| #2 | 🇷🇺 Russia | 701.7 | 17.4% |
| #3 | 🇮🇷 Iran | 256.7 | 6.4% |
| #4 | 🇨🇳 China | 209.2 | 5.2% |
| #5 | 🇶🇦 Qatar | 177.0 | 4.4% |
| #6 | 🇨🇦 Canada | 172.3 | 4.3% |
| #7 | 🇦🇺 Australia | 147.2 | 3.6% |
| #8 | 🇸🇦 Saudi Arabia | 117.3 | 2.9% |
| #9 | 🇳🇴 Norway | 114.3 | 2.8% |
| #10 | 🇩🇿 Algeria | 100.8 | 2.5% |
| #12 | 🇹🇲 Turkmenistan | 79.3 | 2.0% |
| #13 | 🇲🇾 Malaysia | 74.2 | 1.8% |
| #14 | 🇪🇬 Egypt | 67.8 | 1.7% |
| #15 | 🇮🇩 Indonesia | 59.3 | 1.5% |
| #16 | 🇦🇪 United Arab Emirates | 57.0 | 1.4% |
| #17 | 🇺🇿 Uzbekistan | 50.9 | 1.3% |
| #18 | 🇳🇬 Nigeria | 45.9 | 1.1% |
| 🌐 Rest of the World | 671.8 | 16.6% | |
| 🌐 Global Total | 4,036.9 | 100.0% |
Natural gas accounts for 32% of primary energy consumption in the United States, the world’s largest producer. Russia is the second biggest producer, and also has at least 37 trillion cubic meters of natural gas reserves, the most in the world.
China’s natural gas production grew by 7.8% in 2021, and it has nearly doubled since 2011. This sustained growth in production is partly down to government policies incentivizing coal-to-gas switching.
Europe’s Natural Gas Crisis
Russia has significantly reduced flows of natural gas to Europe since Western nations imposed sanctions on the Kremlin following the invasion of Ukraine. Before the war, the European Union (EU) imported about 40% of its natural gas from Russia.
The gas is transported by the Nord Stream system, a pair of offshore natural gas pipeline networks in Europe that run under the Baltic Sea from Russia to Germany.
Russian energy giant Gazprom recently halved the amount of natural gas flowing through the Nord Stream 1 pipeline to 20% of capacity, blaming Western sanctions for a delay in the delivery in a necessary turbine. EU officials say Russia is “weaponizing” its gas supply.
Amid tensions, the EU bloc outlined a plan to phase out dependence on Russian fossil fuels. Lithuania ceased Russian gas imports at the beginning of April. Estonia’s and Latvia’s imports also dropped to zero at the start of that month. Bulgaria, the Netherlands, and Poland all announced that they do not intend to renew long-term contracts with Gazprom.
Despite these efforts, Europe remains dependent on Russia for its supply of natural gas, at least in the short and medium term.


Energy
The World’s Biggest Nuclear Energy Producers
China has grown its nuclear capacity over the last decade, now ranking second on the list of top nuclear energy producers.


The World’s Biggest Nuclear Energy Producers
This was originally posted on our Voronoi app. Download the app for free on Apple or Android and discover incredible data-driven charts from a variety of trusted sources.
Scientists in South Korea recently broke a record in a nuclear fusion experiment. For 48 seconds, they sustained a temperature seven times that of the sun’s core.
But generating commercially viable energy from nuclear fusion still remains more science fiction than reality. Meanwhile, its more reliable sibling, nuclear fission, has been powering our world for many decades.
In this graphic, we visualized the top producers of nuclear energy by their share of the global total, measured in terawatt hours (TWh). Data for this was sourced from the Nuclear Energy Institute, last updated in August 2022.
Which Country Generates the Most Nuclear Energy?
Nuclear energy production in the U.S. is more than twice the amount produced by China (ranked second) and France (ranked third) put together. In total, the U.S. accounts for nearly 30% of global nuclear energy output.
However, nuclear power only accounts for one-fifth of America’s electricity supply. This is in contrast to France, which generates 60% of its electricity from nuclear plants.
| Rank | Country | Nuclear Energy Produced (TWh) | % of Total |
|---|---|---|---|
| 1 | 🇺🇸 U.S. | 772 | 29% |
| 2 | 🇨🇳 China | 383 | 14% |
| 3 | 🇫🇷 France | 363 | 14% |
| 4 | 🇷🇺 Russia | 208 | 8% |
| 5 | 🇰🇷 South Korea | 150 | 6% |
| 6 | 🇨🇦 Canada | 87 | 3% |
| 7 | 🇺🇦 Ukraine | 81 | 3% |
| 8 | 🇩🇪 Germany | 65 | 2% |
| 9 | 🇯🇵 Japan | 61 | 2% |
| 10 | 🇪🇸 Spain | 54 | 2% |
| 11 | 🇸🇪 Sweden | 51 | 2% |
| 12 | 🇧🇪 Belgium | 48 | 2% |
| 13 | 🇬🇧 UK | 42 | 2% |
| 14 | 🇮🇳 India | 40 | 2% |
| 15 | 🇨🇿 Czech Republic | 29 | 1% |
| N/A | 🌐 Other | 219 | 8% |
| N/A | 🌍 Total | 2,653 | 100% |
Another highlight is how China has rapidly grown its nuclear energy capabilities in the last decade. Between 2016 and 2021, for example, it increased its share of global nuclear energy output from less than 10% to more than 14%, overtaking France for second place.
On the opposite end, the UK’s share has slipped to 2% over the same time period.
Meanwhile, Ukraine has heavily relied on nuclear energy to power its grid. In March 2022, it lost access to its key Zaporizhzhia Nuclear Power Station after Russian forces wrested control of the facility. With six 1,000 MW reactors, the plant is one of the largest in Europe. It is currently not producing any power, and has been the site of recent drone attacks.

-

 Maps2 weeks ago
Mapped: Average Wages Across Europe
-

 Money1 week ago
Which States Have the Highest Minimum Wage in America?
-

 Real Estate1 week ago
Ranked: The Most Valuable Housing Markets in America
-

 Markets1 week ago
Charted: Big Four Market Share by S&P 500 Audits
-

 AI1 week ago
The Stock Performance of U.S. Chipmakers So Far in 2024
-

 Automotive2 weeks ago
Almost Every EV Stock is Down After Q1 2024
-

 Money2 weeks ago
Where Does One U.S. Tax Dollar Go?
-

 Green2 weeks ago
Ranked: Top Countries by Total Forest Loss Since 2001