Markets
Which Countries Have the Lowest Inflation?
![]() Subscribe to the Elements free mailing list for more like this
Subscribe to the Elements free mailing list for more like this
Which Countries Have the Lowest Inflation?
This was originally posted on Elements. Sign up to the free mailing list to get beautiful visualizations on natural resource megatrends in your email every week.
Investors are bracing for longer inflation.
The Federal Reserve indicated that more restrictive monetary policy is in the cards amid strong employment gains. In Europe, while inflation has fallen, it is still far above the 2% target. Across the Euro area inflation is estimated to have reached 8.5% in January.
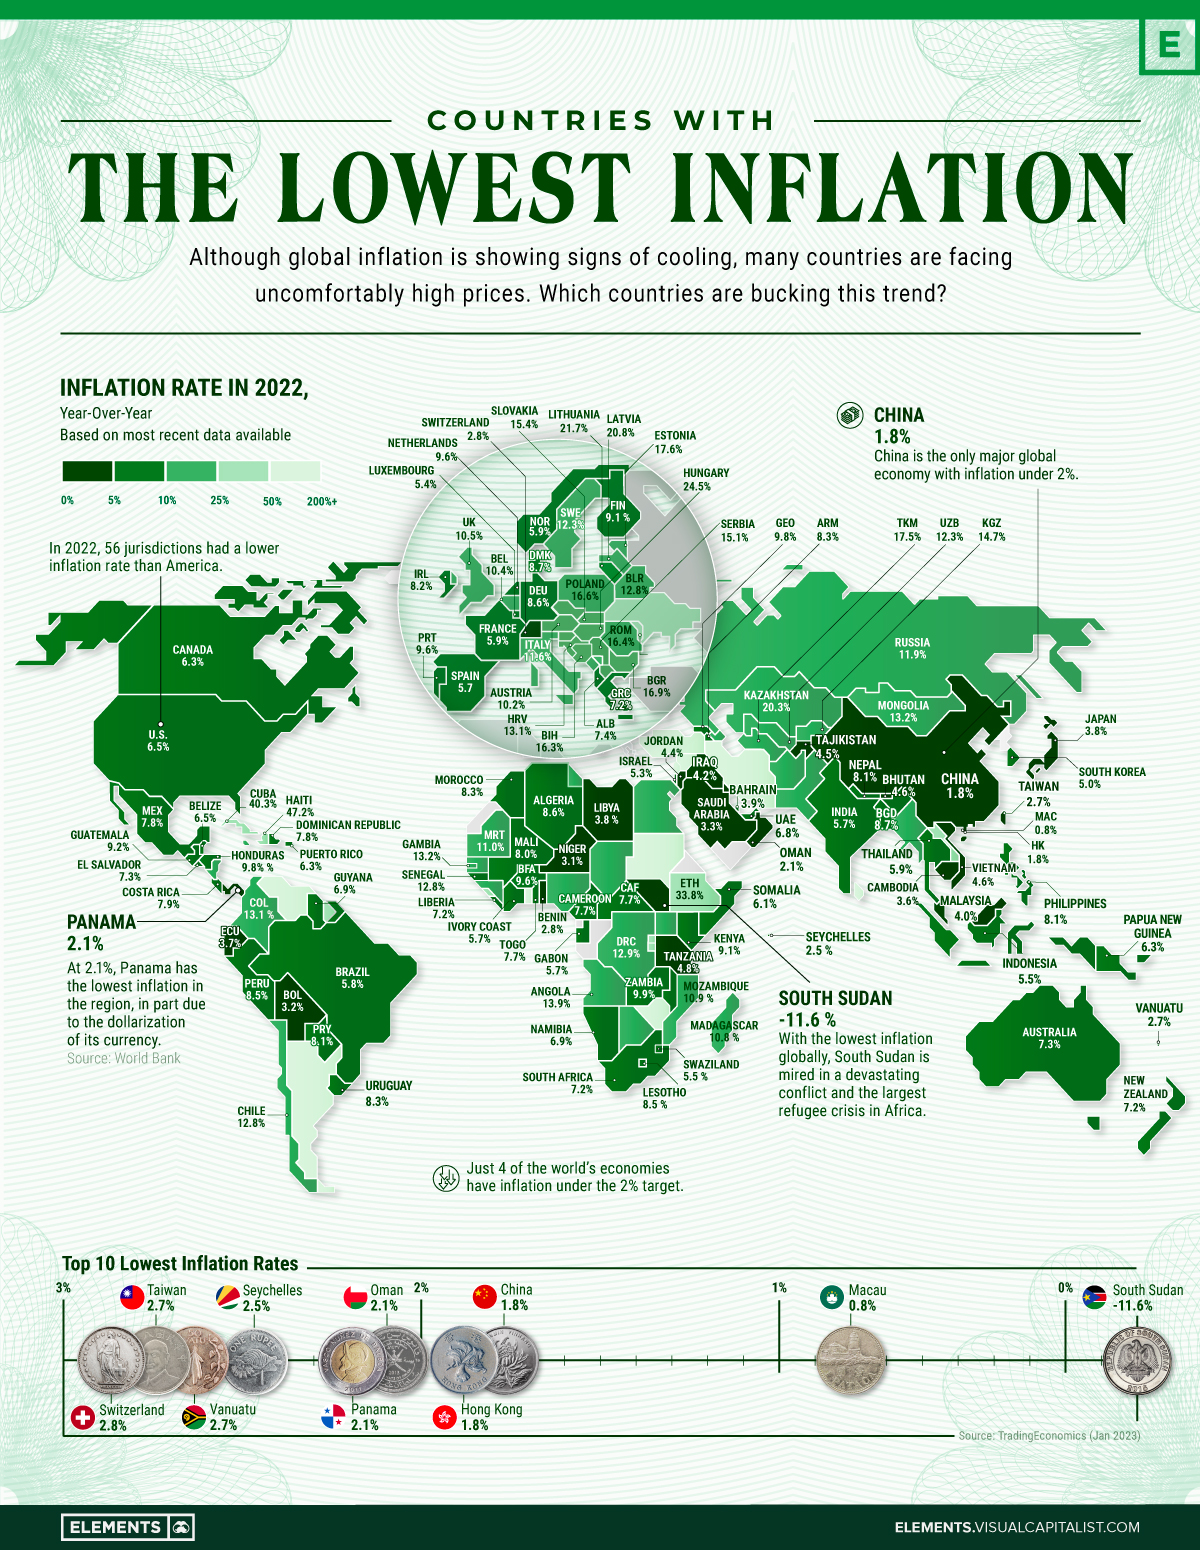
At the same time, some countries have managed to tamp down inflation. Slower growth, cheaper import costs, and foreign exchange policy are some of the factors keeping inflation subdued.
As price pressures rattle global markets, the above infographic maps inflation rates globally using data from Trading Economics, focusing in on the countries with the lowest inflation levels.
World’s Lowest Inflation Rates
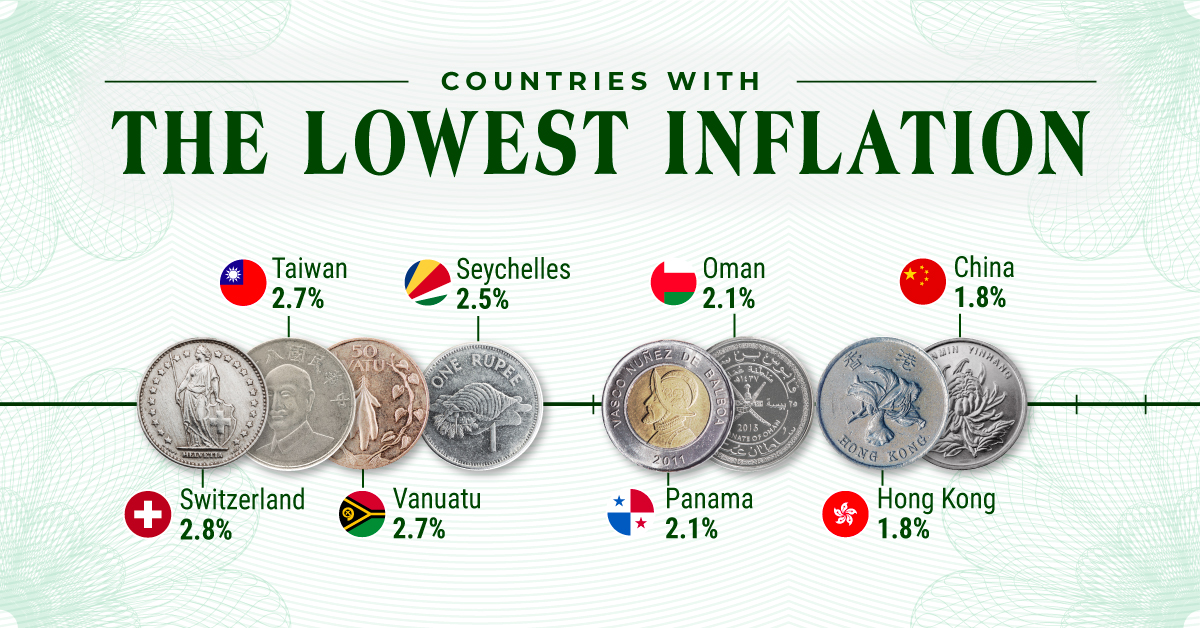
Many of the lowest inflation rates around the world are located in Asia, including Macau, China, Hong Kong, and Taiwan. In this region, widespread lockdowns strained growth and consumer spending, lessening inflationary pressures. Last year, Chinese consumers saved $2.2 trillion in bank deposits during these restrictions which were lifted earlier this year.
Inflation in the region was impacted by several other factors. Earlier on in the pandemic, Asian countries including China were less impacted by rising food costs, services inflation, and supply-chain disruptions, unlike what was seen in North America and Europe.
But now as China has reopened, some signs of inflation are beginning to appear. Food prices are up 4.8% annually in December, and hotel rates are rising.
| Rank | Country / Region | Inflation Rate, Year-Over-Year | Date |
|---|---|---|---|
| 1 | 🇸🇸 South Sudan | -11.6% | Dec 2022 |
| 2 | 🇲🇴 Macau | 0.8% | Nov 2022 |
| 3 | 🇨🇳 China | 1.8% | Dec 2022 |
| 4 | 🇭🇰 Hong Kong SAR | 1.8% | Nov 2022 |
| 5 | 🇴🇲 Oman | 2.1% | Nov 2022 |
| 6 | 🇵🇦 Panama | 2.1% | Dec 2022 |
| 7 | 🇸🇨 Seychelles | 2.5% | Dec 2022 |
| 8 | 🇻🇺 Vanuatu | 2.7% | Mar 2022 |
| 9 | 🇹🇼 Taiwan | 2.7% | Dec 2022 |
| 10 | 🇨🇭 Switzerland | 2.8% | Dec 2022 |
| 11 | 🇱🇮 Liechtenstein | 2.8% | Dec 2022 |
| 12 | 🇧🇯 Benin | 2.8% | Dec 2022 |
| 13 | 🇲🇻 Maldives | 2.8% | Nov 2022 |
| 14 | 🇳🇪 Niger | 3.1% | Dec 2022 |
| 15 | 🇧🇳 Brunei | 3.1% | Nov 2022 |
| 16 | 🇧🇴 Bolivia | 3.2% | Nov 2022 |
| 17 | 🇰🇼 Kuwait | 3.2% | Nov 2022 |
| 18 | 🇸🇦 Saudi Arabia | 3.3% | Dec 2022 |
| 19 | 🇰🇭 Cambodia | 3.6% | Oct 2022 |
| 20 | 🇫🇯 Fiji | 3.6% | Dec 2022 |
| 21 | 🇪🇨 Ecuador | 3.7% | Dec 2022 |
| 22 | 🇯🇵 Japan | 3.8% | Nov 2022 |
| 23 | 🇱🇾 Libya | 3.8% | Nov 2022 |
| 24 | 🇧🇲 Bermuda | 3.8% | Oct 2022 |
| 25 | 🇧🇭 Bahrain | 3.9% | Nov 2022 |
| 26 | 🇲🇾 Malaysia | 4.0% | Nov 2022 |
| 27 | 🇵🇸 Palestine | 4.1% | Dec 2022 |
| 28 | 🇮🇶 Iraq | 4.2% | Nov 2022 |
| 29 | 🇯🇴 Jordan | 4.4% | Dec 2022 |
| 30 | 🇹🇯 Tajikistan | 4.5% | Nov 2022 |
| 31 | 🇻🇳 Vietnam | 4.6% | Dec 2022 |
| 32 | 🇧🇹 Bhutan | 4.6% | Nov 2022 |
| 33 | 🇹🇿 Tanzania | 4.8% | Dec 2022 |
| 34 | 🇳🇨 New Caledonia | 4.9% | Dec 2022 |
| 35 | 🇰🇷 South Korea | 5.0% | Dec 2022 |
| 36 | 🇮🇱 Israel | 5.3% | Dec 2022 |
| 37 | 🇱🇺 Luxembourg | 5.4% | Dec 2022 |
| 38 | 🇸🇿 Swaziland | 5.5% | Oct 2022 |
| 39 | 🇮🇩 Indonesia | 5.5% | Dec 2022 |
| 40 | 🇬🇦 Gabon | 5.7% | Oct 2022 |
| 41 | 🇨🇮 Ivory Coast | 5.7% | Nov 2022 |
| 42 | 🇪🇸 Spain | 5.7% | Dec 2022 |
| 43 | 🇮🇳 India | 5.7% | Dec 2022 |
| 44 | 🇧🇷 Brazil | 5.8% | Dec 2022 |
| 45 | 🇹🇭 Thailand | 5.9% | Dec 2022 |
| 46 | 🇫🇷 France | 5.9% | Dec 2022 |
| 47 | 🇳🇴 Norway | 5.9% | Dec 2022 |
| 48 | 🇶🇦 Qatar | 5.9% | Dec 2022 |
| 49 | 🇩🇯 Djibouti | 6.1% | Sep 2022 |
| 50 | 🇸🇴 Somalia | 6.1% | Dec 2022 |
| 51 | 🇹🇹 Trinidad and Tobago | 6.2% | Sep 2022 |
| 52 | 🇵🇬 Papua New Guinea | 6.3% | Sep 2022 |
| 53 | 🇵🇷 Puerto Rico | 6.3% | Nov 2022 |
| 54 | 🇨🇦 Canada | 6.3% | Dec 2022 |
| 55 | 🇧🇸 Bahamas | 6.5% | Sep/22 |
| 56 | 🇧🇿 Belize | 6.5% | Nov 2022 |
| 57 | 🇺🇸 U.S. | 6.5% | Dec 2022 |
| 58 | 🇦🇼 Aruba | 6.6% | Nov 2022 |
| 59 | 🇸🇬 Singapore | 6.7% | Nov 2022 |
| 60 | 🇹🇱 East Timor | 6.7% | Nov 2022 |
| 61 | 🇦🇪 UAE | 6.8% | Jun 2022 |
| 62 | 🇳🇦 Namibia | 6.9% | Dec 2022 |
| 63 | 🇬🇾 Guyana | 6.9% | Nov 2022 |
| 64 | 🇳🇿 New Zealand | 7.2% | Sep 2022 |
| 65 | 🇿🇦 South Africa | 7.2% | Dec 2022 |
| 66 | 🇬🇷 Greece | 7.2% | Dec 2022 |
| 67 | 🇱🇷 Liberia | 7.2% | Sep 2022 |
| 68 | 🇦🇺 Australia | 7.3% | Sep 2022 |
| 69 | 🇲🇹 Malta | 7.3% | Dec 2022 |
| 70 | 🇸🇻 El Salvador | 7.3% | Dec 2022 |
| 71 | 🇦🇱 Albania | 7.4% | Dec 2022 |
| 72 | 🇨🇻 Cape Verde | 7.6% | Dec 2022 |
| 73 | 🇨🇲 Cameroon | 7.7% | Sep 2022 |
| 74 | 🇨🇫 Central African Republic | 7.7% | Nov 2022 |
| 75 | 🇹🇬 Togo | 7.7% | Dec 2022 |
| 76 | 🇲🇽 Mexico | 7.8% | Dec 2022 |
| 77 | 🇩🇴 Dominican Republic | 7.8% | Dec 2022 |
| 78 | 🇨🇷 Costa Rica | 7.9% | Dec 2022 |
| 79 | 🇨🇾 Cyprus | 7.9% | Dec 2022 |
| 80 | 🇲🇱 Mali | 8.0% | Nov 2022 |
| 81 | 🇳🇵 Nepal | 8.1% | Nov 2022 |
| 82 | 🇵🇭 Philippines | 8.1% | Dec 2022 |
| 83 | 🇵🇾 Paraguay | 8.1% | Dec 2022 |
| 84 | 🇧🇧 Barbados | 8.2% | Oct 2022 |
| 85 | 🇮🇪 Ireland | 8.2% | Dec 2022 |
| 86 | 🇺🇾 Uruguay | 8.3% | Dec 2022 |
| 87 | 🇲🇦 Morocco | 8.3% | Nov 2022 |
| 88 | 🇦🇲 Armenia | 8.3% | Dec 2022 |
| 89 | 🇵🇪 Peru | 8.5% | Dec 2022 |
| 90 | 🇱🇸 Lesotho | 8.5% | Oct 2022 |
| 91 | 🇩🇿 Algeria | 8.6% | Nov 2022 |
| 92 | 🇩🇪 Germany | 8.6% | Dec 2022 |
| 93 | 🇩🇰 Denmark | 8.7% | Dec 2022 |
| 94 | 🇧🇩 Bangladesh | 8.7% | Dec 2022 |
| 95 | 🇫🇴 Faroe Islands | 8.8% | Sep 2022 |
| 96 | 🇫🇮 Finland | 9.1% | Dec 2022 |
| 97 | 🇰🇪 Kenya | 9.1% | Dec 2022 |
| 98 | 🇰🇾 Cayman Islands | 9.2% | Sep 2022 |
| 99 | 🇬🇹 Guatemala | 9.2% | Dec 2022 |
| 100 | 🇬🇼 Guinea Bissau | 9.4% | Nov 2022 |
*Inflation rates based on latest available data.
Globally, one outlier is South Sudan. Political instability and violence have depressed growth and inflation, which stood at -11.6% in December. As it faces a severe humanitarian crisis, the country has the lowest inflation rate worldwide.
Oil-producing nation Oman has also seen low inflation, at 2.1%. One reason for this is that the Omani rial is pegged to the U.S. dollar, keeping the currency anchored. Inflation has remained moderate over the last decade in the country.
The Country With the Lowest Inflation, by Region
In Europe, Switzerland has the lowest inflation rate, at 2.8%, or roughly one-third of the Euro area’s. It is also the lowest rate in the OECD. The country’s strong currency has shielded it from inflationary pressures and high import prices.
Meanwhile, Swiss production prices have risen marginally above inflation, to 4.1% annually in mid-2022. Last year, the Swiss central bank raised interest rates for the first time since 2007 from -0.75% to -0.25% following 20 years of deflation.
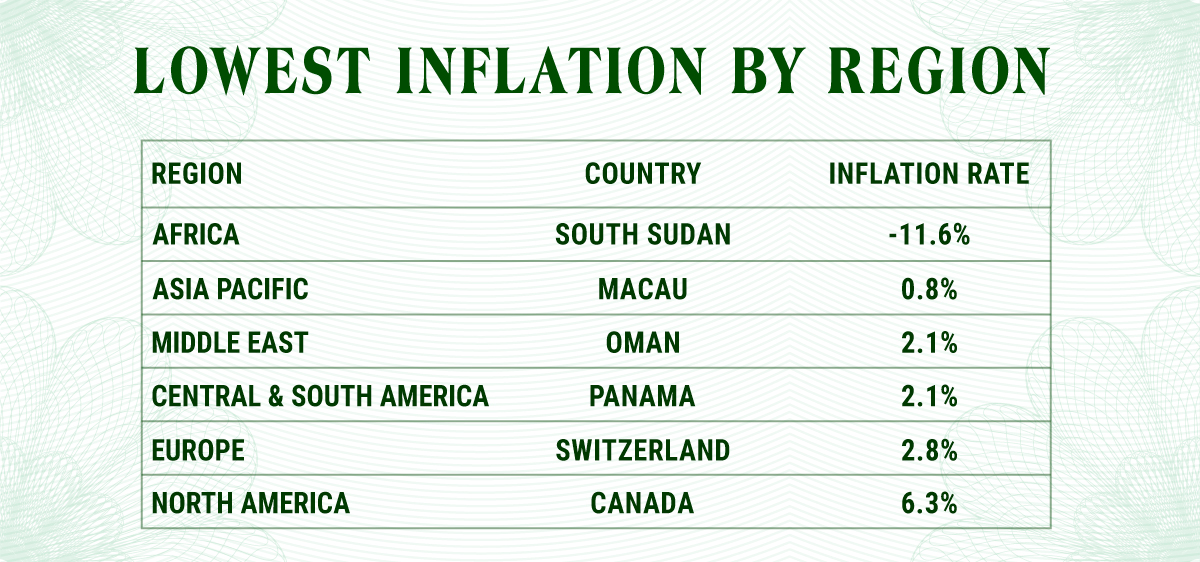
Panama has the lowest rate in Latin America. The dollarization of the Panamanian balboa has helped quash price pressures. In July, the government regulated the price of 72 items to keep the cost of living from rising after three weeks of protests as inflation climbed as high as 5.2% during the course of 2022.
With the lowest inflation in Asia, Macau witnessed the tourism industry fall off a cliff given lockdown measures, and the economy saw both its GDP and inflation collapse in 2022. Its real GDP is projected to have fallen close to 30% for the year.
Future Gazing
The IMF estimates that 84% of countries around the world will have lower inflation than last year. By 2024, both headline and core inflation are projected to remain above pre-pandemic levels at 4.1%.
Opposing forces of China’s reopening and weaker global growth could offset inflationary pressures, yet this interplay—among a host of other factors—remains to be seen.


Markets
U.S. Debt Interest Payments Reach $1 Trillion
U.S. debt interest payments have surged past the $1 trillion dollar mark, amid high interest rates and an ever-expanding debt burden.


U.S. Debt Interest Payments Reach $1 Trillion
This was originally posted on our Voronoi app. Download the app for free on iOS or Android and discover incredible data-driven charts from a variety of trusted sources.
The cost of paying for America’s national debt crossed the $1 trillion dollar mark in 2023, driven by high interest rates and a record $34 trillion mountain of debt.
Over the last decade, U.S. debt interest payments have more than doubled amid vast government spending during the pandemic crisis. As debt payments continue to soar, the Congressional Budget Office (CBO) reported that debt servicing costs surpassed defense spending for the first time ever this year.
This graphic shows the sharp rise in U.S. debt payments, based on data from the Federal Reserve.
A $1 Trillion Interest Bill, and Growing
Below, we show how U.S. debt interest payments have risen at a faster pace than at another time in modern history:
| Date | Interest Payments | U.S. National Debt |
|---|---|---|
| 2023 | $1.0T | $34.0T |
| 2022 | $830B | $31.4T |
| 2021 | $612B | $29.6T |
| 2020 | $518B | $27.7T |
| 2019 | $564B | $23.2T |
| 2018 | $571B | $22.0T |
| 2017 | $493B | $20.5T |
| 2016 | $460B | $20.0T |
| 2015 | $435B | $18.9T |
| 2014 | $442B | $18.1T |
| 2013 | $425B | $17.2T |
| 2012 | $417B | $16.4T |
| 2011 | $433B | $15.2T |
| 2010 | $400B | $14.0T |
| 2009 | $354B | $12.3T |
| 2008 | $380B | $10.7T |
| 2007 | $414B | $9.2T |
| 2006 | $387B | $8.7T |
| 2005 | $355B | $8.2T |
| 2004 | $318B | $7.6T |
| 2003 | $294B | $7.0T |
| 2002 | $298B | $6.4T |
| 2001 | $318B | $5.9T |
| 2000 | $353B | $5.7T |
| 1999 | $353B | $5.8T |
| 1998 | $360B | $5.6T |
| 1997 | $368B | $5.5T |
| 1996 | $362B | $5.3T |
| 1995 | $357B | $5.0T |
| 1994 | $334B | $4.8T |
| 1993 | $311B | $4.5T |
| 1992 | $306B | $4.2T |
| 1991 | $308B | $3.8T |
| 1990 | $298B | $3.4T |
| 1989 | $275B | $3.0T |
| 1988 | $254B | $2.7T |
| 1987 | $240B | $2.4T |
| 1986 | $225B | $2.2T |
| 1985 | $219B | $1.9T |
| 1984 | $205B | $1.7T |
| 1983 | $176B | $1.4T |
| 1982 | $157B | $1.2T |
| 1981 | $142B | $1.0T |
| 1980 | $113B | $930.2B |
| 1979 | $96B | $845.1B |
| 1978 | $84B | $789.2B |
| 1977 | $69B | $718.9B |
| 1976 | $61B | $653.5B |
| 1975 | $55B | $576.6B |
| 1974 | $50B | $492.7B |
| 1973 | $45B | $469.1B |
| 1972 | $39B | $448.5B |
| 1971 | $36B | $424.1B |
| 1970 | $35B | $389.2B |
| 1969 | $30B | $368.2B |
| 1968 | $25B | $358.0B |
| 1967 | $23B | $344.7B |
| 1966 | $21B | $329.3B |
Interest payments represent seasonally adjusted annual rate at the end of Q4.
At current rates, the U.S. national debt is growing by a remarkable $1 trillion about every 100 days, equal to roughly $3.6 trillion per year.
As the national debt has ballooned, debt payments even exceeded Medicaid outlays in 2023—one of the government’s largest expenditures. On average, the U.S. spent more than $2 billion per day on interest costs last year. Going further, the U.S. government is projected to spend a historic $12.4 trillion on interest payments over the next decade, averaging about $37,100 per American.
Exacerbating matters is that the U.S. is running a steep deficit, which stood at $1.1 trillion for the first six months of fiscal 2024. This has accelerated due to the 43% increase in debt servicing costs along with a $31 billion dollar increase in defense spending from a year earlier. Additionally, a $30 billion increase in funding for the Federal Deposit Insurance Corporation in light of the regional banking crisis last year was a major contributor to the deficit increase.
Overall, the CBO forecasts that roughly 75% of the federal deficit’s increase will be due to interest costs by 2034.

-

 Maps1 week ago
The Largest Earthquakes in the New York Area (1970-2024)
-

 Money2 weeks ago
Where Does One U.S. Tax Dollar Go?
-

 Automotive2 weeks ago
Almost Every EV Stock is Down After Q1 2024
-

 AI2 weeks ago
The Stock Performance of U.S. Chipmakers So Far in 2024
-

 Markets2 weeks ago
Charted: Big Four Market Share by S&P 500 Audits
-

 Real Estate2 weeks ago
Ranked: The Most Valuable Housing Markets in America
-

 Money2 weeks ago
Which States Have the Highest Minimum Wage in America?
-

 AI2 weeks ago
Ranked: Semiconductor Companies by Industry Revenue Share