Misc
Visualizing Which Countries Drink the Most Beer


Visualizing Which Countries Drink the Most Beer
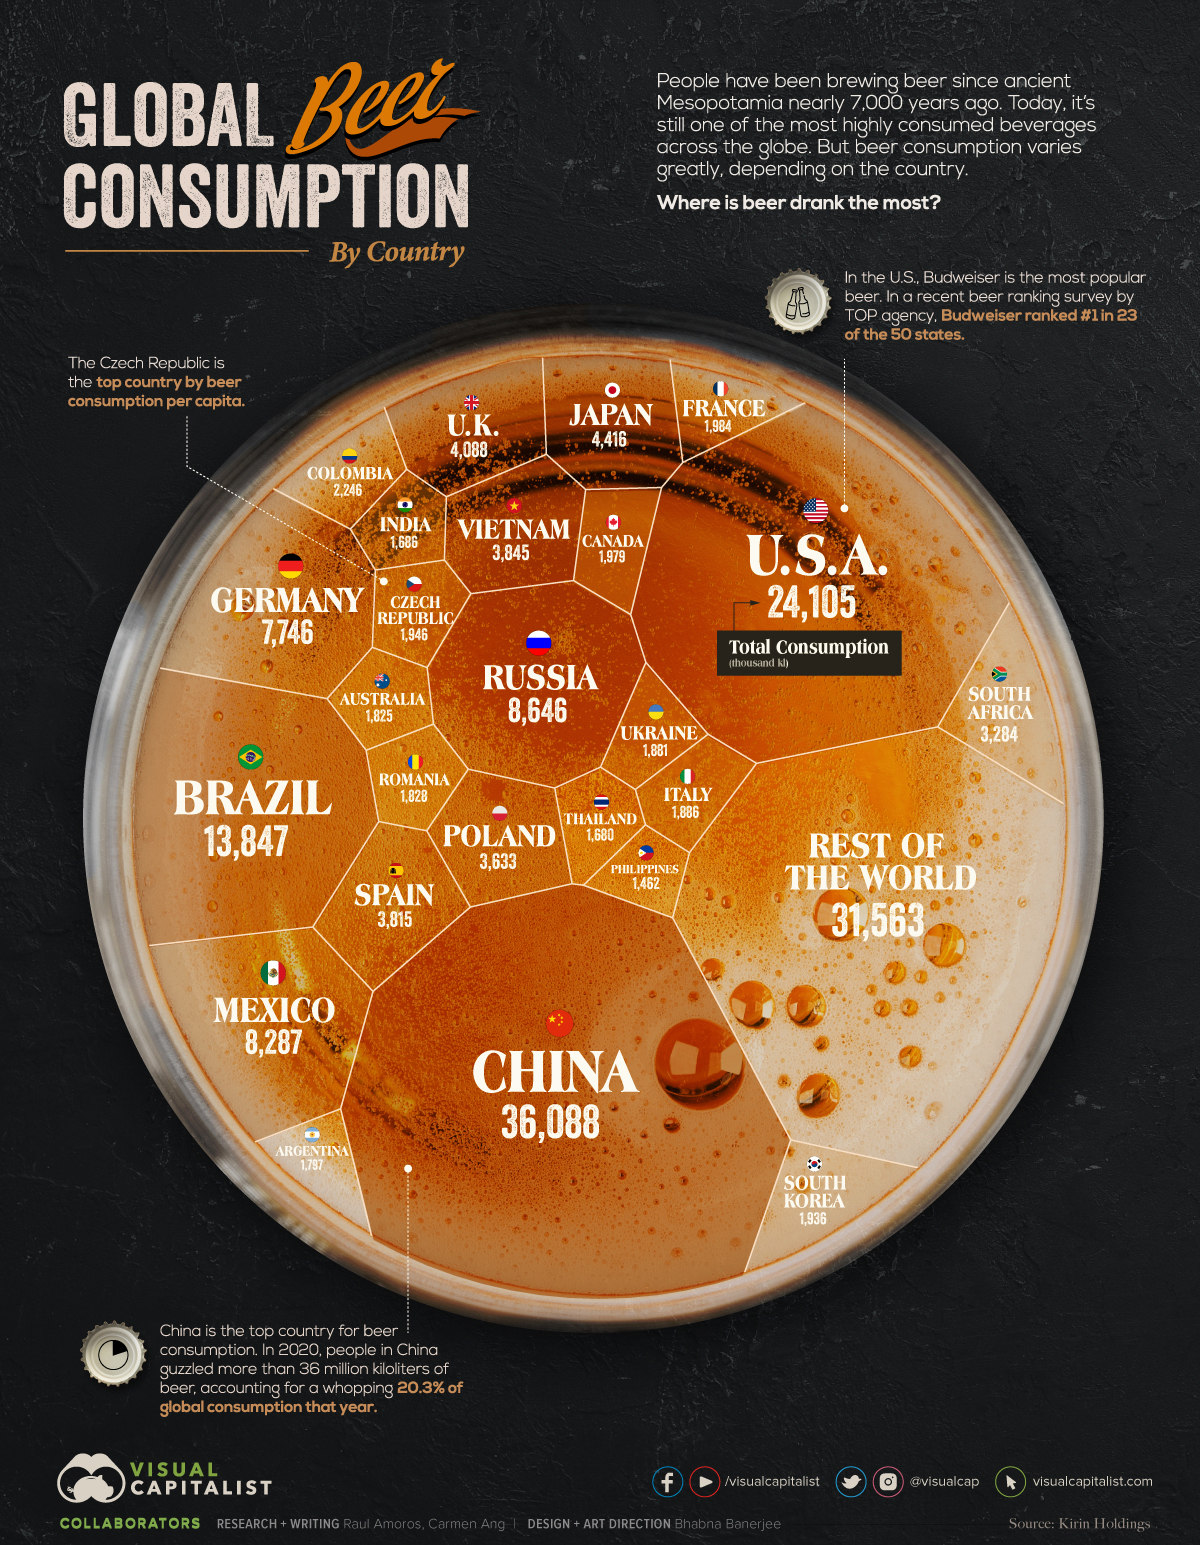
Humans have been drinking beer for thousands of years—and since it’s still one of the most popular beverages worldwide, it seems we haven’t gotten sick of it yet. The latest available data shows that beer consumption exceeded 177 million kiloliters around the world in 2020.
Beer consumption occurs all over the world, but the amount varies greatly depending on the location. So, which countries drink the most beer?
This graphic uses data from Kirin Holdings to compare global beer consumption by country. Kirin is a Japanese company that has been tracking beer consumption around the world since 1975.
Which Countries Drink the Most Beer?
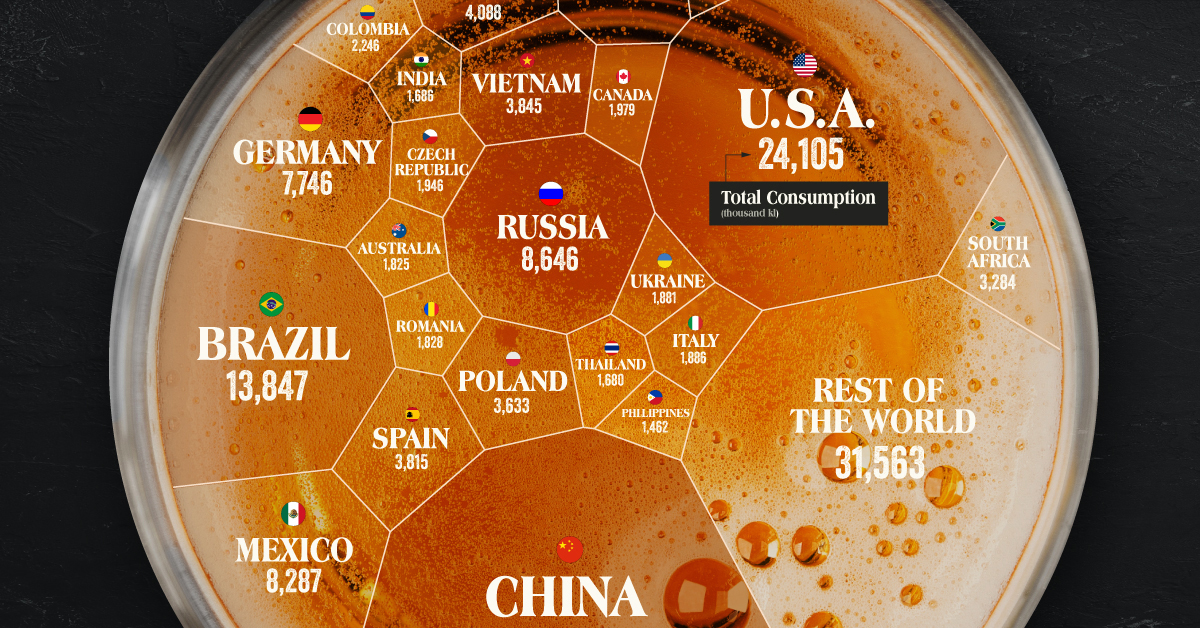
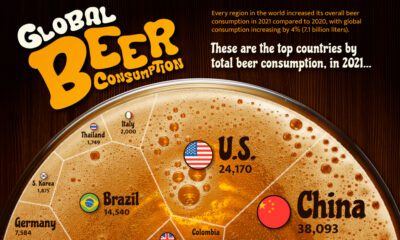
When it comes to total beer consumption, China ranks number one.
In 2020, the country’s consumption reached 36 million kiloliters—that’s enough beer to fill more than 14,000 Olympic-sized pools. The country accounts for a whopping one-fifth of total beer consumption worldwide. Archaeological evidence also suggests that China has a beer producing history that goes back thousands of years.
Here’s a look at the top 25 countries for beer consumption, and their global market share:
| Ranking 2020 | Country | Total Consumption (thousand kl) | Global Market Share |
|---|---|---|---|
| 1 | 🇨🇳 China | 36,088 | 20.30% |
| 2 | 🇺🇸 United States of America | 24,105 | 13.60% |
| 3 | 🇧🇷 Brazil | 13,847 | 7.80% |
| 4 | 🇷🇺 Russia | 8,646 | 4.90% |
| 5 | 🇲🇽 Mexico | 8,287 | 4.70% |
| 6 | 🇩🇪 Germany | 7,746 | 4.40% |
| 7 | 🇯🇵 Japan | 4,416 | 2.50% |
| 8 | 🇬🇧 United Kingdom | 4,088 | 2.30% |
| 9 | 🇻🇳 Vietnam | 3,845 | 2.20% |
| 10 | 🇪🇸 Spain | 3,815 | 2.10% |
| 11 | 🇵🇱 Poland | 3,633 | 2.00% |
| 12 | 🇿🇦 South Africa | 3,284 | 1.90% |
| 13 | 🇨🇴 Colombia | 2,246 | 1.30% |
| 14 | 🇫🇷 France | 1,984 | 1.10% |
| 15 | 🇨🇦 Canada | 1,979 | 1.10% |
| 16 | 🇨🇿 Czech Republic | 1,946 | 1.10% |
| 17 | 🇰🇷 South Korea | 1,936 | 1.10% |
| 18 | 🇮🇹 Italy | 1,886 | 1.10% |
| 19 | 🇺🇦 Ukraine | 1,881 | 1.10% |
| 20 | 🇷🇴 Romania | 1,828 | 1.00% |
| 21 | 🇦🇺 Australia | 1,825 | 1.00% |
| 22 | 🇦🇷 Argentina | 1,797 | 1.00% |
| 23 | 🇮🇳 India | 1,686 | 0.90% |
| 24 | 🇹🇭 Thailand | 1,680 | 0.90% |
| 25 | 🇵🇭 Philippines | 1,462 | 0.80% |
| Rest of the World | 31,563 | 17.78% |
China is the most populous country in the world, accounting for about 18% of the global population. Of course, a large population doesn’t necessarily translate to high beer consumption at the individual level. For instance, India, which has the second highest population in the world, ranks 23rd on the list for beer consumption, and only accounts for 1% of what foamy liquid gets guzzled down each year.
The U.S. comes second on the list, with more than 24 million kiloliters of beer consumed throughout the country in 2020. Americans don’t just drink a lot of beer—they brew a lot of beer, too. The U.S. is the second-largest beer producer worldwide (after China).
Beer Consumption Per Capita
Things look a bit different when you look at beer consumption per capita, rather than total beer consumption. The Czech Republic comes in first when it comes to beer consumption per capita.
In 2020, the average Czech drank more than 181 liters of beer.
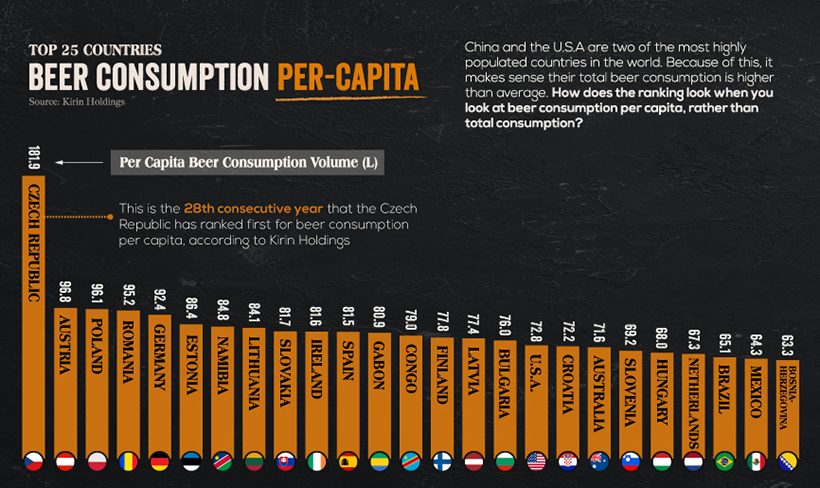
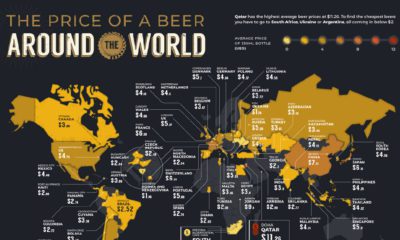
The Czech Republic is well-known for inexpensive beer. Some travel sites even claim that, in certain parts of the country, beer can be cheaper than bottled water.
International Beer Day
While consumption levels vary across the world, beer is an integral part of many countries’ cultures. In fact, the beverage is so popular, that it’s been given its own day. International Beer Day is celebrated on the first Friday of every August in over 200 cities across the globe.
Cheers, and happy sipping!


Misc
How Hard Is It to Get Into an Ivy League School?
We detail the admission rates and average annual cost for Ivy League schools, as well as the median SAT scores required to be accepted.


How Hard Is It to Get Into an Ivy League School?
This was originally posted on our Voronoi app. Download the app for free on iOS or Android and discover incredible data-driven charts from a variety of trusted sources.
Ivy League institutions are renowned worldwide for their academic excellence and long-standing traditions. But how hard is it to get into one of the top universities in the U.S.?
In this graphic, we detail the admission rates and average annual cost for Ivy League schools, as well as the median SAT scores required to be accepted. The data comes from the National Center for Education Statistics and was compiled by 24/7 Wall St.
Note that “average annual cost” represents the net price a student pays after subtracting the average value of grants and/or scholarships received.
Harvard is the Most Selective
The SAT is a standardized test commonly used for college admissions in the United States. It’s taken by high school juniors and seniors to assess their readiness for college-level academic work.
When comparing SAT scores, Harvard and Dartmouth are among the most challenging universities to gain admission to. The median SAT scores for their students are 760 for reading and writing and 790 for math. Still, Harvard has half the admission rate (3.2%) compared to Dartmouth (6.4%).
| School | Admission rate (%) | SAT Score: Reading & Writing | SAT Score: Math | Avg Annual Cost* |
|---|---|---|---|---|
| Harvard University | 3.2 | 760 | 790 | $13,259 |
| Columbia University | 3.9 | 750 | 780 | $12,836 |
| Yale University | 4.6 | 760 | 780 | $16,341 |
| Brown University | 5.1 | 760 | 780 | $26,308 |
| Princeton University | 5.7 | 760 | 780 | $11,080 |
| Dartmouth College | 6.4 | 760 | 790 | $33,023 |
| University of Pennsylvania | 6.5 | 750 | 790 | $14,851 |
| Cornell University | 7.5 | 750 | 780 | $29,011 |
*Costs after receiving federal financial aid.
Additionally, Dartmouth has the highest average annual cost at $33,000. Princeton has the lowest at $11,100.
While student debt has surged in the United States in recent years, hitting $1.73 trillion in 2023, the worth of obtaining a degree from any of the schools listed surpasses mere academics. This is evidenced by the substantial incomes earned by former students.
Harvard grads, for example, have the highest average starting salary in the country, at $91,700.

-

 Mining2 weeks ago
Charted: The Value Gap Between the Gold Price and Gold Miners
-

 Real Estate1 week ago
Ranked: The Most Valuable Housing Markets in America
-

 Business1 week ago
Charted: Big Four Market Share by S&P 500 Audits
-

 AI1 week ago
The Stock Performance of U.S. Chipmakers So Far in 2024
-

 Misc1 week ago
Almost Every EV Stock is Down After Q1 2024
-

 Money2 weeks ago
Where Does One U.S. Tax Dollar Go?
-

 Green2 weeks ago
Ranked: Top Countries by Total Forest Loss Since 2001
-

 Real Estate2 weeks ago
Visualizing America’s Shortage of Affordable Homes