Green
Which Countries are Mapping the Ocean Floor?
Which Countries are Mapping the Ocean Floor?
Our vast and complex planet is becoming less mysterious with each passing day.
Consider the following:
- Thousands of satellites are now observing every facet of our planet
- Around three-quarters of Earth’s land surface is now influenced by human activity
- Aircraft-based LIDAR mapping is creating new models of the physical world in staggering detail
But, despite all of these impressive advances, our collective knowledge of the ocean floor still has some surprising blind spots.
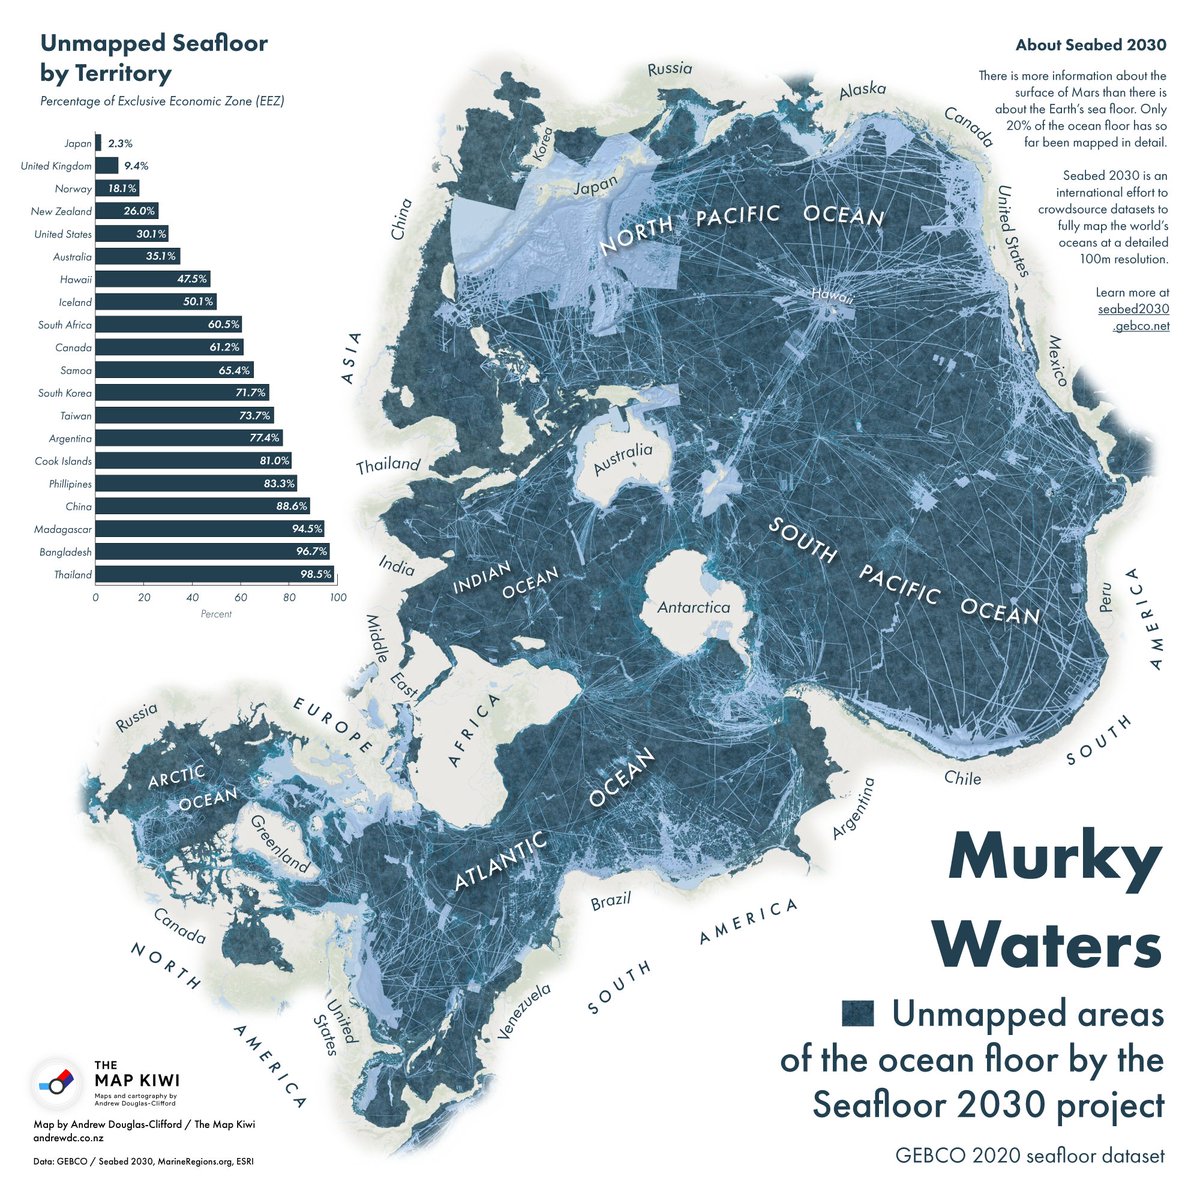
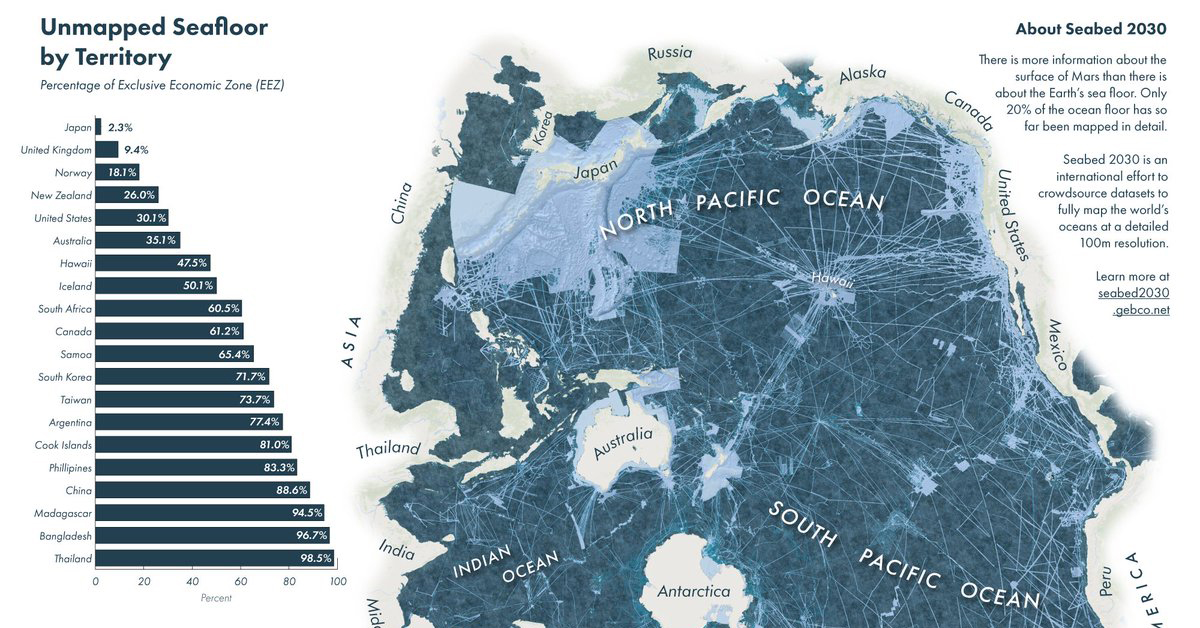
Today’s unique map from cartographer Andrew Douglas-Clifford (aka The Map Kiwi) focuses on ocean territory instead of land, highlighting the vast areas of the ocean floor that remain unmapped. Which countries are exploring their offshore territory, and how much of the ocean floor still remains a mystery to us? Let’s dive in.
What Do We Know Right Now?
Today, we have a surprisingly incomplete picture of what lies beneath the waves. In fact, if you were to fly from Los Angeles to Sydney, the bulk of your journey would take place over territory that is mapped in only the broadest sense.
Most of what we know about the ocean floor’s topography was pieced together from gravity data gathered by satellites. While useful as a starting point, the resulting spatial resolution is about two square miles (5km). By comparison, topographic maps of Mars and Venus have a resolution that’s 50x more detailed.
As the map above clearly illustrates, only a few large pieces of the ocean have been mapped—and not surprisingly, many of these higher resolution portions lie along the world’s shipping lanes.
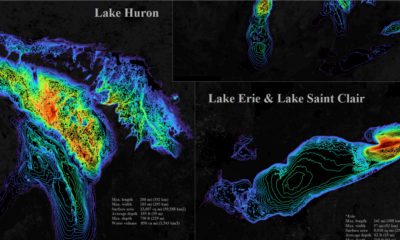
Another way to see this clear difference in resolution is through Google Maps:
As you can see above, these shipping lanes running through the Pacific Ocean have been mapped at a higher resolution that the surrounding ocean floor.
The Countries Mapping the Ocean Floor
The closer an area is to a population center, the higher the likelihood it has been mapped. That said, many countries still have a long way to go before they have a clear picture of their land beneath the waves.
Here is a snapshot of how far along countries are in their subsea mapping efforts:
| Countries/territories | Size of Exclusive Economic Zone* (EEZ) | Percentage of EEZ mapped |
|---|---|---|
| Japan | 1,729,501 mi² (4,479,388 km²) | 97.7% |
| United Kingdom | 2,627,651 mi² (6,805,586 km²) | 90.6% |
| Norway | 920,922 mi² (2,385,178 km²) | 81.9% |
| New Zealand | 1,576,742 mi² (4,083,744 km²) | 74.0% |
| United States | 4,382,645 mi² (11,351,000 km²) | 69.9% |
| Australia | 3,283,933 mi² (8,505,348 km²) | 64.9% |
| Iceland | 291,121 mi² (754,000 km²) | 49.9% |
| South Africa | 592,874 mi² (1,535,538 km²) | 39.5% |
| Canada | 2,161,815 mi² (5,599,077 km²) | 38.8% |
| Samoa | 49,401 mi² (127,950 km²) | 34.6% |
| South Korea | 183,579 mi² (475,469 km²) | 28.3% |
| Taiwan | 32,135 mi² (83,231 km²) | 26.3% |
| Argentina | 447,516 mi² (1,159,063 km²) | 22.6% |
| Cook Islands | 756,770 mi² (1,960,027 km²) | 29.0% |
| Phillippines | 614,203 mi² (1,590,780 km²) | 16.7% |
| China | 338,618 mi² (877,019 km²) | 11.4% |
| Madagascar | 473,075 mi² (1,225,259 km²) | 5.5% |
| Bangladesh | 45,873 mi² (118,813 km²) | 3.3% |
| Thailand | 115,597 mi² (299,397 km²) | 1.5% |
*An exclusive economic zone (EEZ) is the sea zone stretching 200 nautical miles (nmi) from the coast of a state.
Japan and the UK, which have the 5th and 8th largest EEZs respectively, are the clear leaders in mapping their ocean territory.
Piecing Together the Puzzle
Sometimes tragedy can have a silver lining. By the time the search for Malaysia Airlines Flight 370 concluded in 2014, scientists had gained access to more than 100,000 square miles of newly mapped sections of the Indian Ocean.
Of course, it will take a more systematic approach and sustained effort to truly map the world’s ocean floors. Thankfully, a project called Seabed 2030 has the ambitious goal of mapping the entire ocean floor by 2030. The organization is collaborating with existing mapping initiatives in various regions to compile bathymetric information (undersea map data).
It’s been said without hyperbole that we know more about the surface of Mars than we do about our own planet’s seabed, but thanks to the efforts of Seabed 2030 and other initiatives around the world, puzzle pieces are finally falling into place.


Green
How Carbon Credits Can Help Close the Climate Funding Gap
To keep a 1.5℃ world within reach, global emissions need to fall by as much as 45% by 2030, and carbon credits could help close the gap.


How Carbon Credits Can Help Close the Climate Funding Gap
Governments around the world have committed to the goals of the Paris Agreement, but their climate pledges are insufficient. To keep a 1.5℃ world within reach, global emissions need to fall by as much as 45% by 2030.
Bold and immediate action is essential, but so are resources that will make it happen.
In this graphic, we have partnered with Carbon Streaming to look at the role that the voluntary carbon market and carbon credits can play in closing that gap.
More Funds are Needed for Climate Finance
According to data from the Climate Policy Initiative, climate finance, which includes funds for both adaptation and mitigation, needs to increase at least five-fold, from $1.3T in 2021/2022, to an average $8.6T annually until 2030, and then to just over $10T in the two decades leading up to 2050.
That adds up to a very large number, but consider that in 2022, $7.0T went to fossil fuel subsidies, which almost covers the annual estimated outlay. And the world has shown that when pressed, governments can come up with the money, if the global pandemic is any indication.
Mobilizing Carbon Finance to the Developing World
But the same cannot be said of the developing world, where debt, inequality, and poverty reduce the ability of governments to act. And this is where carbon credits can play an important role. According to analyses from Ecosystem Marketplace, carbon credits help move capital from developed countries, to where funds are needed in the developing world.
For example, in 2019, 69.2% of the carbon credits by volume in the voluntary carbon market were purchased by buyers in Europe, and nearly a third from North America. Compare that to over 90% of the volume of carbon credits sold in the voluntary carbon market in 2022 came from projects that were located outside of those two regions.
Carbon Credits Can Complement Decarbonization Efforts
Carbon credits can also complement decarbonization efforts in the corporate world, where more and more companies have been signing up to reduce emissions. According to the 2022 monitoring report from the Science Based Targets initiative, 4,230 companies around the world had approved targets and commitments, which represented an 88% increase from the prior year. However, as of year end 2022, combined scope 1 and 2 emissions covered by science-based targets totaled approximately 2 GtCO2e, which represents just a fraction of global emissions.
The fine print is that this is just scope 1 and 2 emissions, and doesn’t include scope 3 emissions, which can account for more than 70% of a company’s total emissions. And as these emissions come under greater and greater scrutiny the closer we get to 2030 and beyond, the voluntary carbon credit market could expand exponentially to help meet the need to compensate for these emissions.
Potential Carbon Credit Market Size in 2030
OK, but how big? In 2022, the voluntary carbon credit market was around $2B, but some analysts predict that it could grow to between $5–250 billion by 2030.
| Firm | Low Estimate | High Estimate |
|---|---|---|
| Bain & Company | $15B | $30B |
| Barclays | N/A | $250B |
| Citigroup | $5B | $50B |
| McKinsey & Company | $5B | $50B |
| Morgan Stanley | N/A | $100B |
| Shell / Boston Consulting Group | $10B | $40B |
Morgan Stanley and Barclays were the most bullish on the size of the voluntary carbon credit market in 2030, but the latter firm was even more optimistic about 2050, and predicted that the voluntary carbon credit market could grow to a colossal $1.5 trillion.
Carbon Streaming is Focused on Carbon Credit Integrity
Ultimately, carbon credits could have an important role to play in marshaling the resources needed to keep the world on track to net zero by 2050, and avoiding the worst consequences of a warming world.
Carbon Streaming uses streaming transactions, a proven and flexible funding model, to scale high-integrity carbon credit projects to advance global climate action and UN Sustainable Development Goals.
Learn more at www.carbonstreaming.com.

-

 Green1 week ago
Ranking the Top 15 Countries by Carbon Tax Revenue
This graphic highlights France and Canada as the global leaders when it comes to generating carbon tax revenue.
-

 Green1 week ago
Ranked: The Countries With the Most Air Pollution in 2023
South Asian nations are the global hotspot for pollution. In this graphic, we rank the world’s most polluted countries according to IQAir.
-

 Environment2 weeks ago
Top Countries By Forest Growth Since 2001
One country is taking reforestation very seriously, registering more than 400,000 square km of forest growth in two decades.
-

 Green3 weeks ago
Ranked: Top Countries by Total Forest Loss Since 2001
The country with the most forest loss since 2001 lost as much forest cover as the next four countries combined.
-

 Markets2 months ago
The World’s Top Cocoa Producing Countries
Here are the largest cocoa producing countries globally—from Côte d’Ivoire to Brazil—as cocoa prices hit record highs.
-

 Environment2 months ago
Charted: Share of World Forests by Country
We visualize which countries have the biggest share of world forests by area—and while country size plays a factor, so too, does the environment.


-
Green1 week ago
Ranked: The Countries With the Most Air Pollution in 2023
-

 Automotive2 weeks ago
Almost Every EV Stock is Down After Q1 2024
-

 AI2 weeks ago
The Stock Performance of U.S. Chipmakers So Far in 2024
-

 Markets2 weeks ago
Charted: Big Four Market Share by S&P 500 Audits
-

 Real Estate2 weeks ago
Ranked: The Most Valuable Housing Markets in America
-

 Money2 weeks ago
Which States Have the Highest Minimum Wage in America?
-

 AI2 weeks ago
Ranked: Semiconductor Companies by Industry Revenue Share
-

 Travel2 weeks ago
Ranked: The World’s Top Flight Routes, by Revenue