Misc
What Does the Average Rent Get You in These U.S. Cities?
What Does the Average Rent Get You in These U.S. Cities?
Housing markets in general are linked to a variety of national variables: interest rates, unemployment, mortgage availability, consumer confidence, inflation, and overall economic health. However, they can also be extremely regional in nature, and this is why there can be such variations in domestic prices.
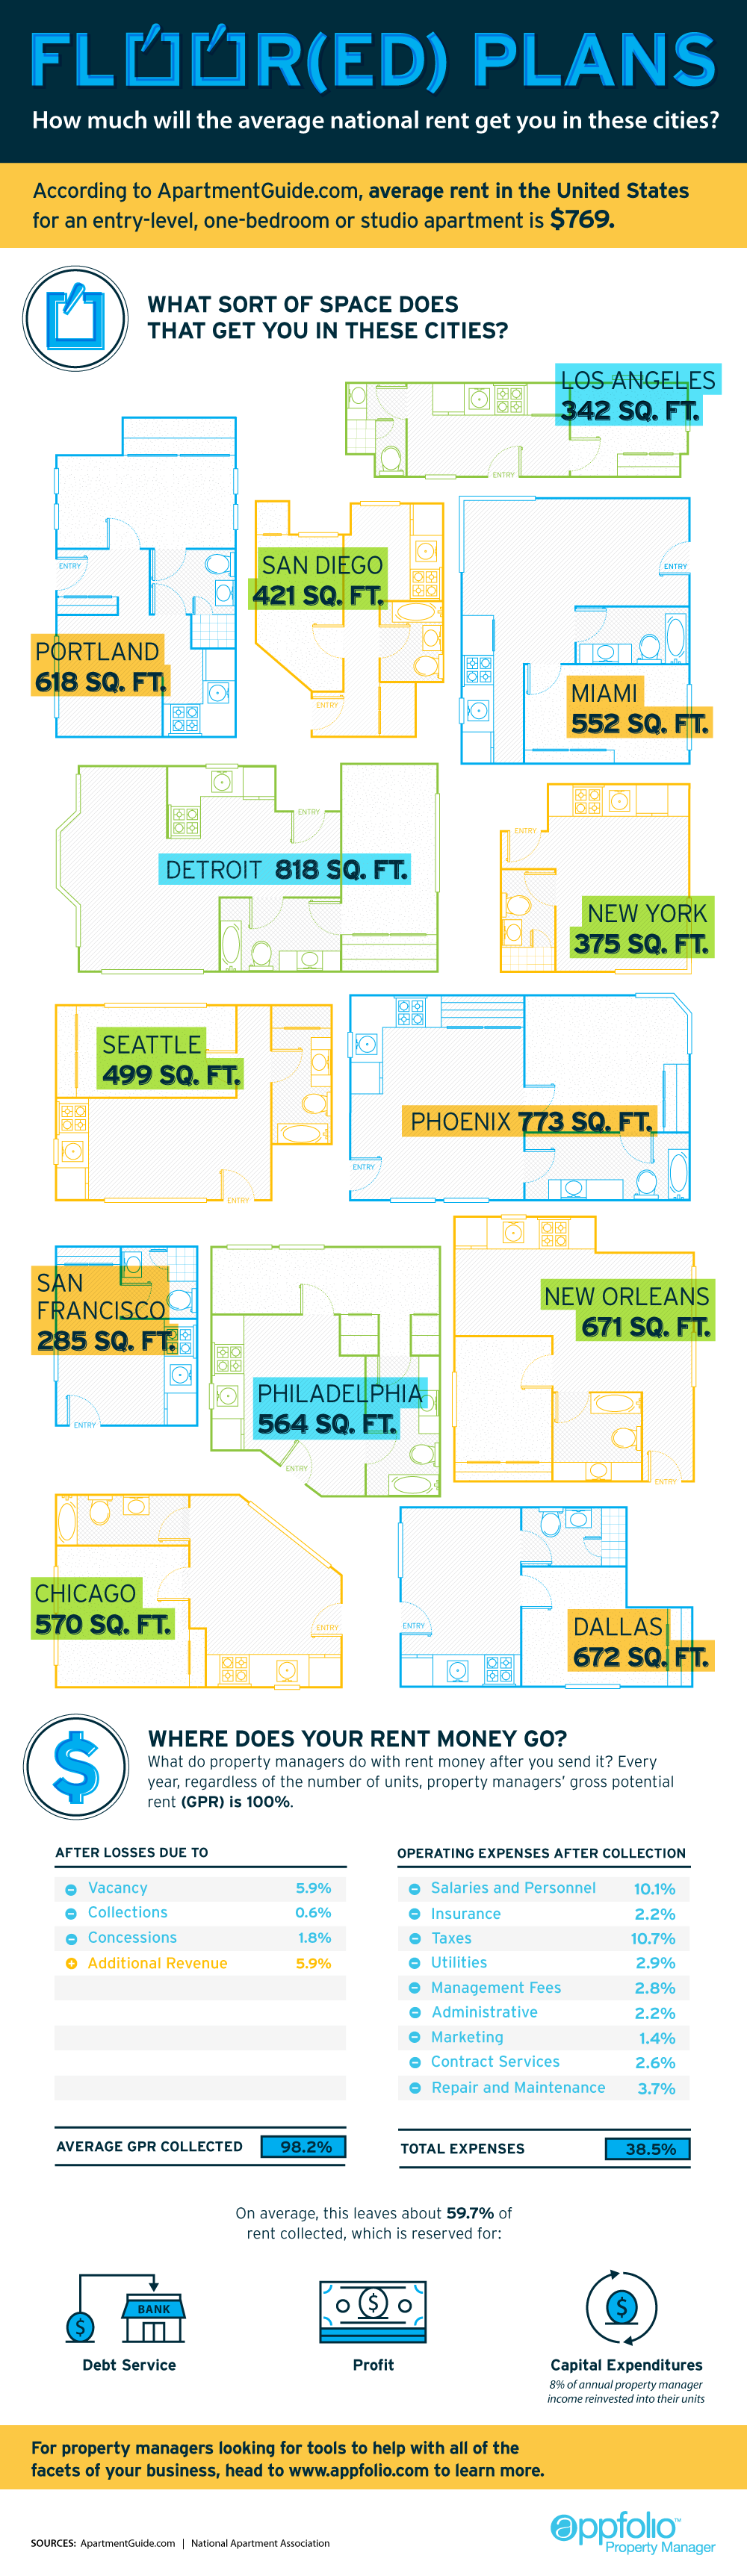
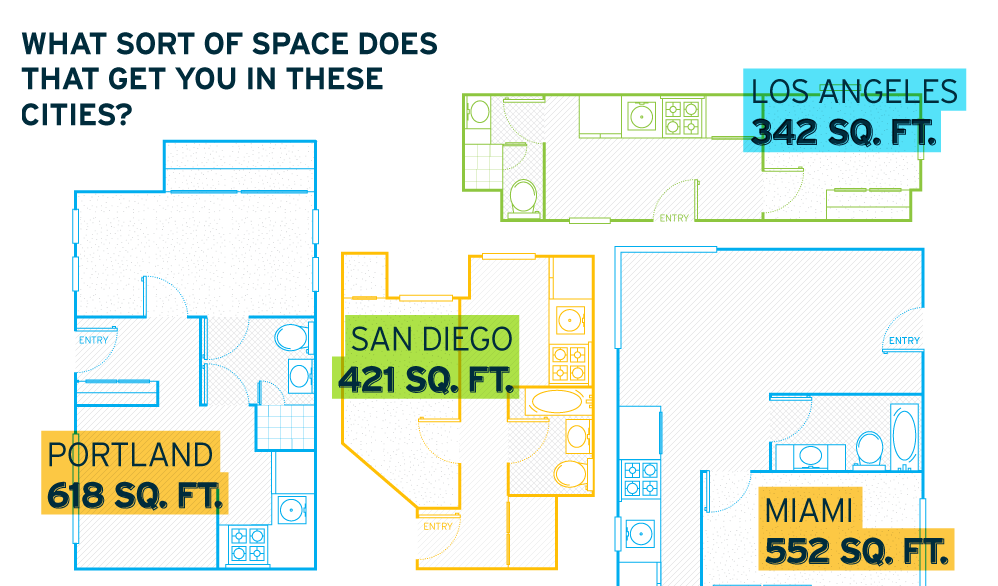
Even though Canada still takes claim for the most overvalued housing market in the world, there are parts of America that look just as bubbly. This infographic looks at what renters could get in various cities while paying the average national monthly rent for an entry-level, one-bedroom or studio apartment ($769).
The results vary.
In Detroit, a city still emerging from its bankruptcy troubles, a renter could get 818 sq. ft. of space for the average rent. There is still some value in Chicago, Miami, and New Orleans, where the average national rent gets places of 570, 552, and 671 sq. ft. respectively.
In the Big Apple, it is understandable that housing is hard to come by. The average amount can only get 375 sq. ft.
However, where things really break down is in the Golden State, specifically in the Bay Area. New renters in San Francisco will find that the average national rent is only enough to get a kitchen and maybe a bathroom with just 285 sq. ft of space. Things are so bad in the city that shipping containers are getting converted to small homes and being rented out illegally for $1,000 per month. Someone even pitched a tent in their garden in Mountainview and listed it for $899 per month.
The fuel for San Francisco’s housing woes lies in the influx of high-paying tech companies and jobs in Silicon Valley, foreign home buyers bidding up prices, complicated housing and renting regulations, lack of general supply, and stifling bureaucracy.
Original graphic by: Mashable


VC+
VC+: Get Our Key Takeaways From the IMF’s World Economic Outlook
A sneak preview of the exclusive VC+ Special Dispatch—your shortcut to understanding IMF’s World Economic Outlook report.

Have you read IMF’s latest World Economic Outlook yet? At a daunting 202 pages, we don’t blame you if it’s still on your to-do list.
But don’t worry, you don’t need to read the whole April release, because we’ve already done the hard work for you.
To save you time and effort, the Visual Capitalist team has compiled a visual analysis of everything you need to know from the report—and our upcoming VC+ Special Dispatch will be available exclusively to VC+ members on Thursday, April 25th.
If you’re not already subscribed to VC+, make sure you sign up now to receive the full analysis of the IMF report, and more (we release similar deep dives every week).
For now, here’s what VC+ members can expect to receive.
Your Shortcut to Understanding IMF’s World Economic Outlook
With long and short-term growth prospects declining for many countries around the world, this Special Dispatch offers a visual analysis of the key figures and takeaways from the IMF’s report including:
- The global decline in economic growth forecasts
- Real GDP growth and inflation forecasts for major nations in 2024
- When interest rate cuts will happen and interest rate forecasts
- How debt-to-GDP ratios have changed since 2000
- And much more!

Get the Full Breakdown in the Next VC+ Special Dispatch
VC+ members will receive the full Special Dispatch on Thursday, April 25th.
Make sure you join VC+ now to receive exclusive charts and the full analysis of key takeaways from IMF’s World Economic Outlook.
Don’t miss out. Become a VC+ member today.
What You Get When You Become a VC+ Member
VC+ is Visual Capitalist’s premium subscription. As a member, you’ll get the following:
- Special Dispatches: Deep dive visual briefings on crucial reports and global trends
- Markets This Month: A snappy summary of the state of the markets and what to look out for
- The Trendline: Weekly curation of the best visualizations from across the globe
- Global Forecast Series: Our flagship annual report that covers everything you need to know related to the economy, markets, geopolitics, and the latest tech trends
- VC+ Archive: Hundreds of previously released VC+ briefings and reports that you’ve been missing out on, all in one dedicated hub
You can get all of the above, and more, by joining VC+ today.

-

 Green1 week ago
Ranked: The Countries With the Most Air Pollution in 2023
-

 AI2 weeks ago
The Stock Performance of U.S. Chipmakers So Far in 2024
-

 Markets2 weeks ago
Charted: Big Four Market Share by S&P 500 Audits
-

 Real Estate2 weeks ago
Ranked: The Most Valuable Housing Markets in America
-

 Money2 weeks ago
Which States Have the Highest Minimum Wage in America?
-

 AI2 weeks ago
Ranked: Semiconductor Companies by Industry Revenue Share
-

 Travel2 weeks ago
Ranked: The World’s Top Flight Routes, by Revenue
-

 Demographics2 weeks ago
Population Projections: The World’s 6 Largest Countries in 2075