Datastream
What Does 30 Years of Global Deforestation Look Like?
The following content is sponsored by The LEAF Coalition
The Briefing
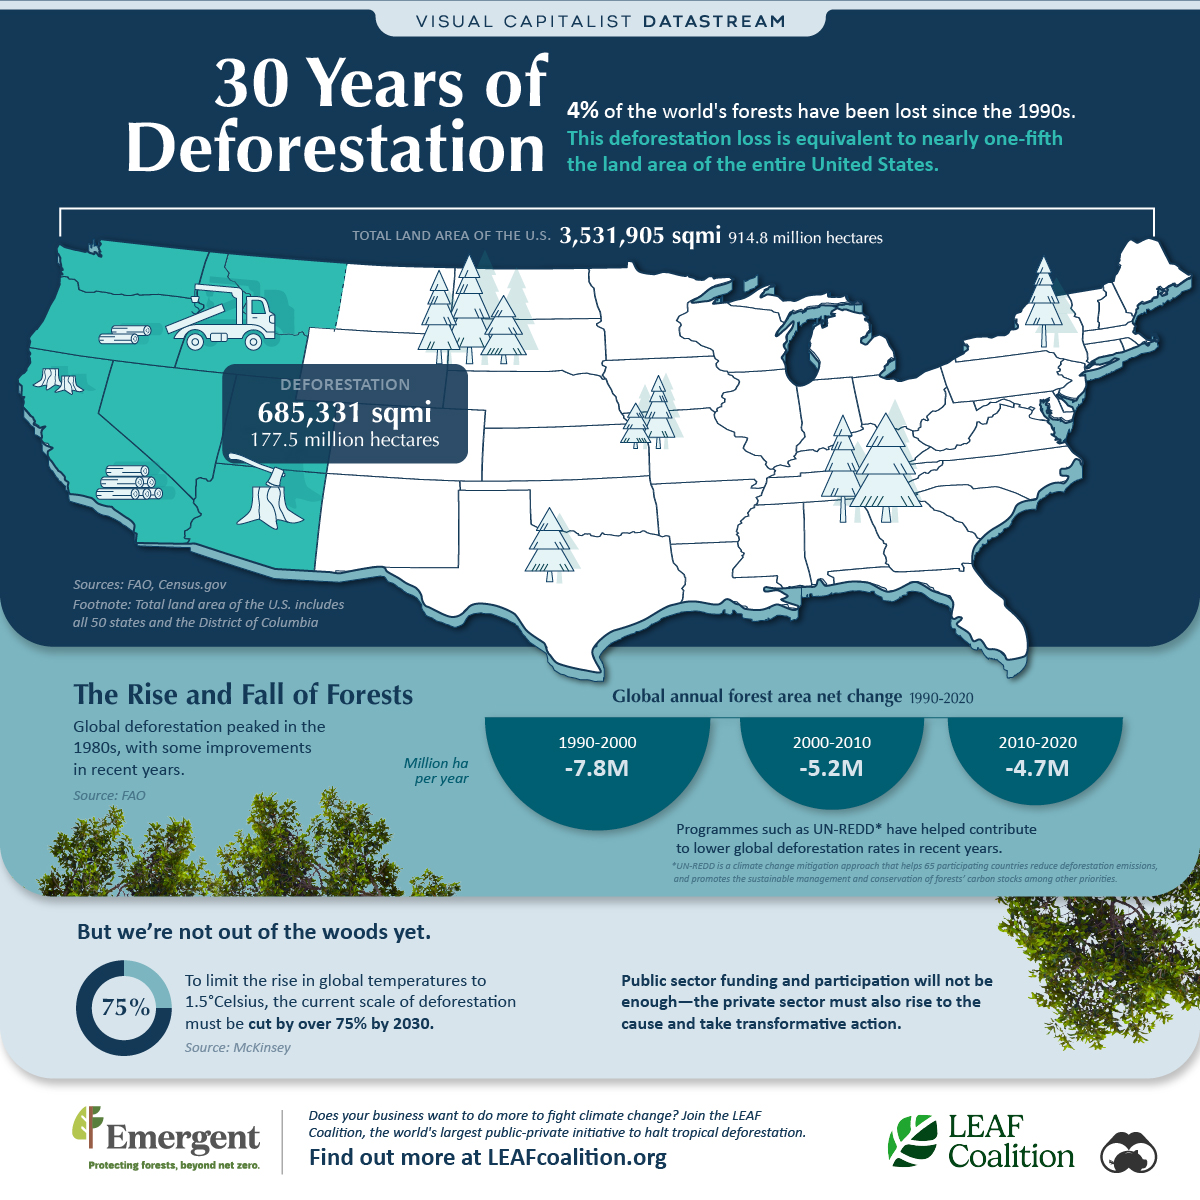
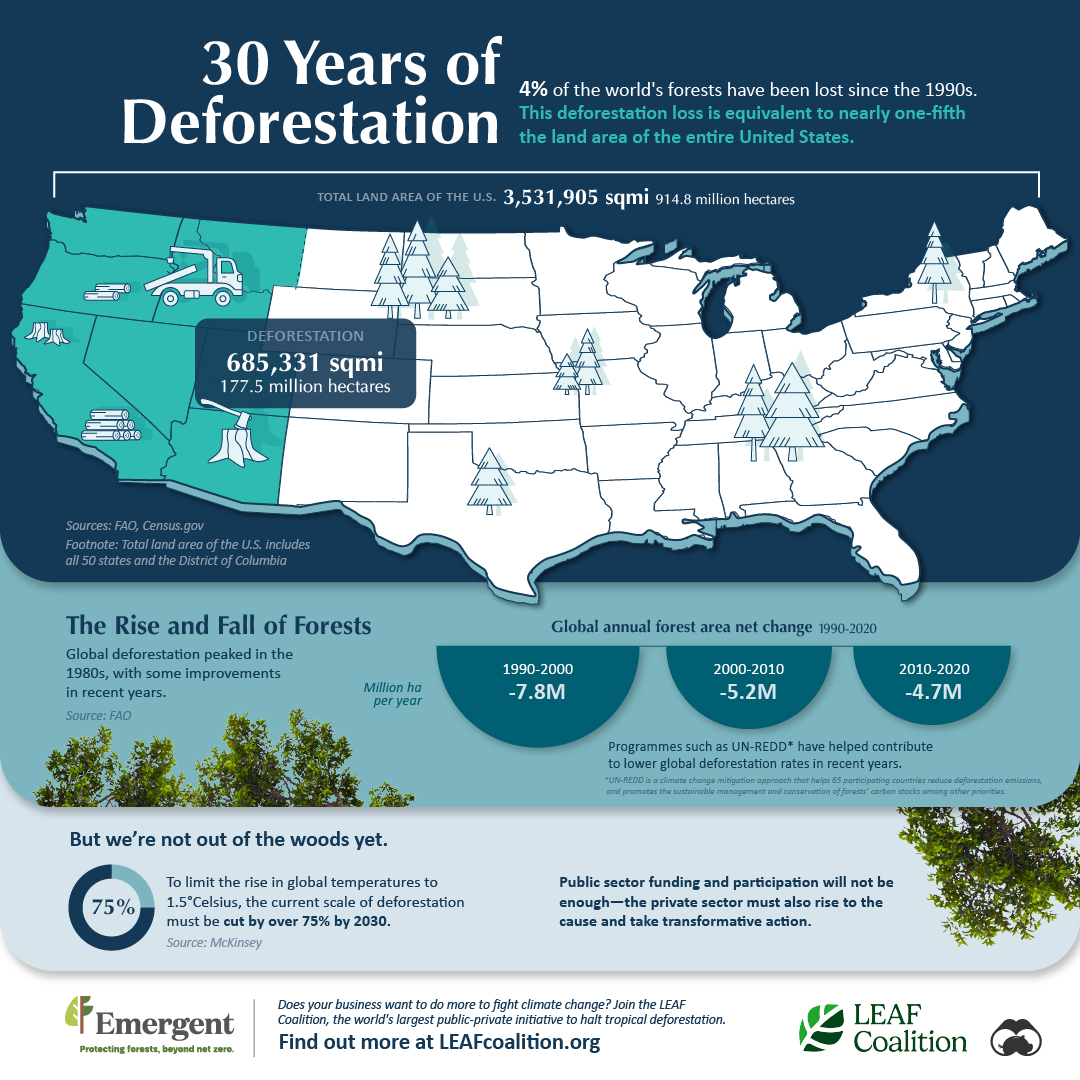
- 177.5 million hectares of land have been lost to deforestation since the 1990s
- Deforestation accounts for 10% of global carbon emissions
30 Years of Deforestation
Estimates say deforestation practices need to be thwarted by 75% by 2030, in order to effectively manage rising global average temperatures. But when looking at deforestation data over the last 30 years, it’s clear we’ve gone in the opposite direction.
This sponsored graphic from The LEAF Coalition looks at the total land lost to deforestation since the 1990s and compares it to the total land in the U.S. as a point of reference.
The Rise and Fall of Forests
Approximately 4% of the world’s forests have been lost since the 1990s. This is equivalent to 177.5 million hectares or 685,000 square miles, and greater than the total land area of 179 countries in the world. In addition, this covers one-fifth of the land in America. Here’s how the average global annual net change in forest area looks on a decade-by-decade basis.
| Period | Global Annual Forest Area Net Change (Hectares) |
|---|---|
| 2010-2020 | -4.7M ha |
| 2000-2010 | -5.2M ha |
| 1990-2000 | -7.8M ha |
A silver lining here is that in the most recent decade that’s passed we’ve seen a reduction in the amount of deforestation. Compared to the late 1990s, the decade between 2010 and 2020 has seen yearly deforestation reduce by 3.1 million hectares from 7.8 million to 4.7 million.
However, there’s still plenty of work that needs to be done and the devastating impact deforestation has on the environment cannot be understated.
Not Out of the Woods Yet
By some estimates, 30% of the globe’s carbon emissions are absorbed by forests each year. In order to keep our global average temperatures at 1.5°C, action needs to ramp up to diminish deforestation. One solution is to open up funding and participation to the private sector and bridge their efforts with that of the public sector.
Swift action is required in order to slow deforestation and decelerate rising average temperatures. See how The LEAF Coalition, a public-private initiative is accelerating climate action by providing results-based finance to countries committed to protecting tropical forests.


Datastream
Can You Calculate Your Daily Carbon Footprint?
Discover how the average person’s carbon footprint impacts the environment and learn how carbon credits can offset your carbon footprint.


The Briefing
- A person’s carbon footprint is substantial, with activities such as food consumption creating as much as 4,500 g of CO₂ emissions daily.
- By purchasing carbon credits from Carbon Streaming Corporation, you can offset your own emissions and fund positive climate action.
Your Everyday Carbon Footprint
While many large businesses and countries have committed to net-zero goals, it is essential to acknowledge that your everyday activities also contribute to global emissions.
In this graphic, sponsored by Carbon Streaming Corporation, we will explore how the choices we make and the products we use have a profound impact on our carbon footprint.
Carbon Emissions by Activity
Here are some of the daily activities and products of the average person and their carbon footprint, according to Clever Carbon.
| Household Activities & Products | CO2 Emissions (g) |
|---|---|
| 💡 Standard Light Bulb (100 watts, four hours) | 172 g |
| 📱 Mobile Phone Use (195 minutes per day)* | 189 g |
| 👕 Washing Machine (0.63 kWh) | 275 g |
| 🔥 Electric Oven (1.56 kWh) | 675 g |
| ♨️ Tumble Dryer (2.5 kWh) | 1,000 g |
| 🧻 Toilet Roll (2 ply) | 1,300 g |
| 🚿 Hot Shower (10 mins) | 2,000 g |
| 🚙 Daily Commute (one hour, by car) | 3,360 g |
| 🍽️ Average Daily Food Consumption (three meals of 600 calories) | 4,500 g |
| *Phone use based on yearly use of 69kg per the source, Reboxed | |
Your choice of transportation plays a crucial role in determining your carbon footprint. For instance, a 15 km daily commute to work on public transport generates an average of 1,464 g of CO₂ emissions. Compared to 3,360 g—twice the volume for a journey the same length by car.
By opting for more sustainable modes of transport, such as cycling, walking, or public transportation, you can significantly reduce your carbon footprint.
Addressing Your Carbon Footprint
One way to compensate for your emissions is by purchasing high-quality carbon credits.
Carbon credits are used to help fund projects that avoid, reduce or remove CO₂ emissions. This includes nature-based solutions such as reforestation and improved forest management, or technology-based solutions such as the production of biochar and carbon capture and storage (CCS).
While carbon credits offer a potential solution for individuals to help reduce global emissions, public awareness remains a significant challenge. A BCG-Patch survey revealed that only 34% of U.S. consumers are familiar with carbon credits, and only 3% have purchased them in the past.
About Carbon Streaming
By financing the creation or expansion of carbon projects, Carbon Streaming Corporation secures the rights to future carbon credits generated by these sustainable projects. You can then purchase these carbon credits to help fund climate solutions around the world and compensate for your own emissions.
Ready to get involved?
>> Learn more about purchasing carbon credits at Carbon Streaming

-

 Mining2 weeks ago
Charted: The Value Gap Between the Gold Price and Gold Miners
-

 Real Estate1 week ago
Ranked: The Most Valuable Housing Markets in America
-

 Business1 week ago
Charted: Big Four Market Share by S&P 500 Audits
-

 AI1 week ago
The Stock Performance of U.S. Chipmakers So Far in 2024
-

 Misc1 week ago
Almost Every EV Stock is Down After Q1 2024
-

 Money2 weeks ago
Where Does One U.S. Tax Dollar Go?
-

 Green2 weeks ago
Ranked: Top Countries by Total Forest Loss Since 2001
-

 Real Estate2 weeks ago
Visualizing America’s Shortage of Affordable Homes