Energy
Visualizing U.S. Crude Oil and Petroleum Product Imports in 2021
![]() Subscribe to the Elements free mailing list for more like this
Subscribe to the Elements free mailing list for more like this
U.S. Petroleum Product and Crude Oil Imports in 2021: Visualized
This was originally posted on Elements. Sign up to the free mailing list to get beautiful visualizations on natural resource megatrends in your email every week.
Energy independence is top of mind for many nations as Russia’s invasion of Ukraine has prompted sanctions and bans against Russian coal and crude oil imports.
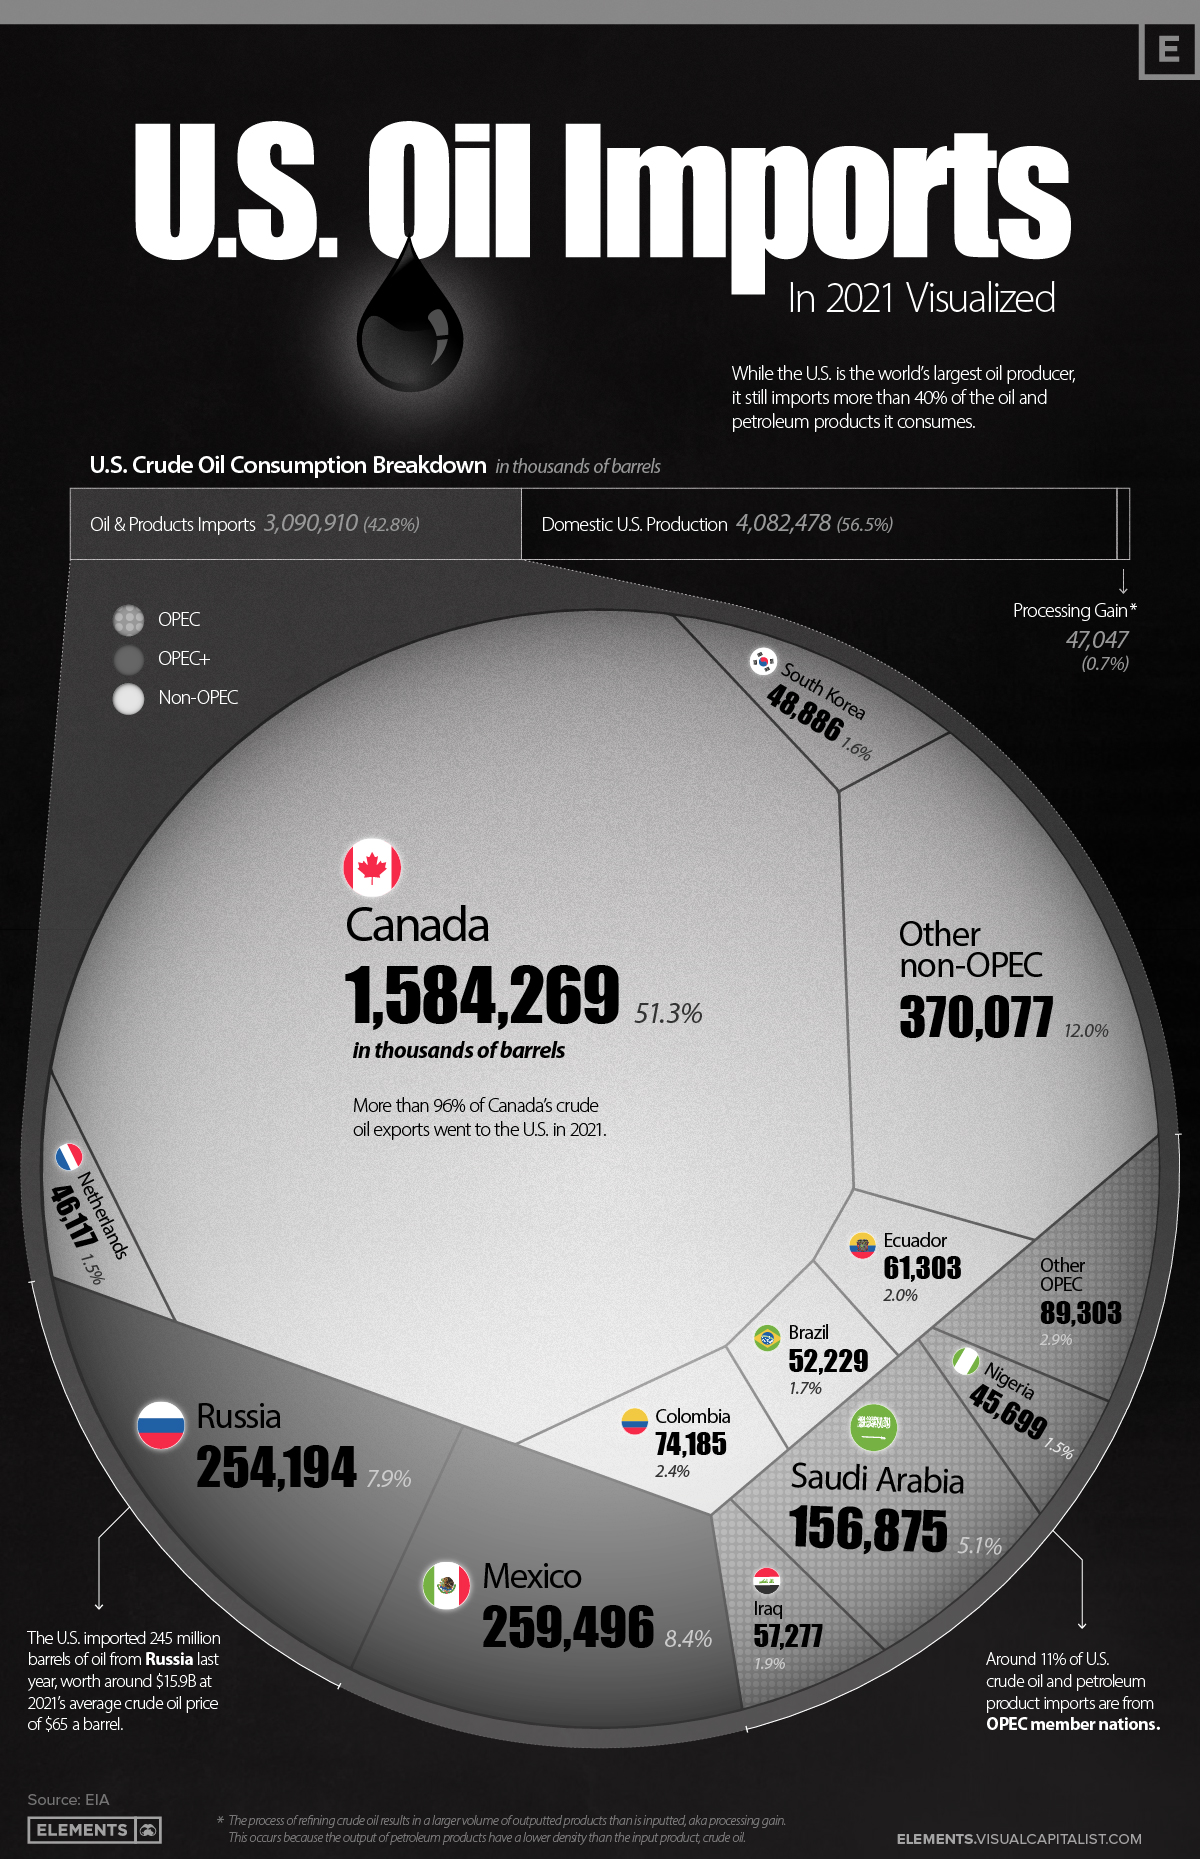
Despite being the world’s largest oil producer, in 2021 the U.S. still imported more than 3 billion barrels of crude oil and petroleum products, equal to 43% of the country’s consumption.
This visualization uses data from the Energy Information Administration (EIA) to compare U.S. crude oil and refined product imports with domestic crude oil production, and breaks down which countries the U.S. imported its oil from in 2021.
U.S. Crude Oil Imports, by Country
The U.S. imports more than 8 million barrels of petroleum products a day from other nations, making it the world’s second-largest importer of crude oil behind China.
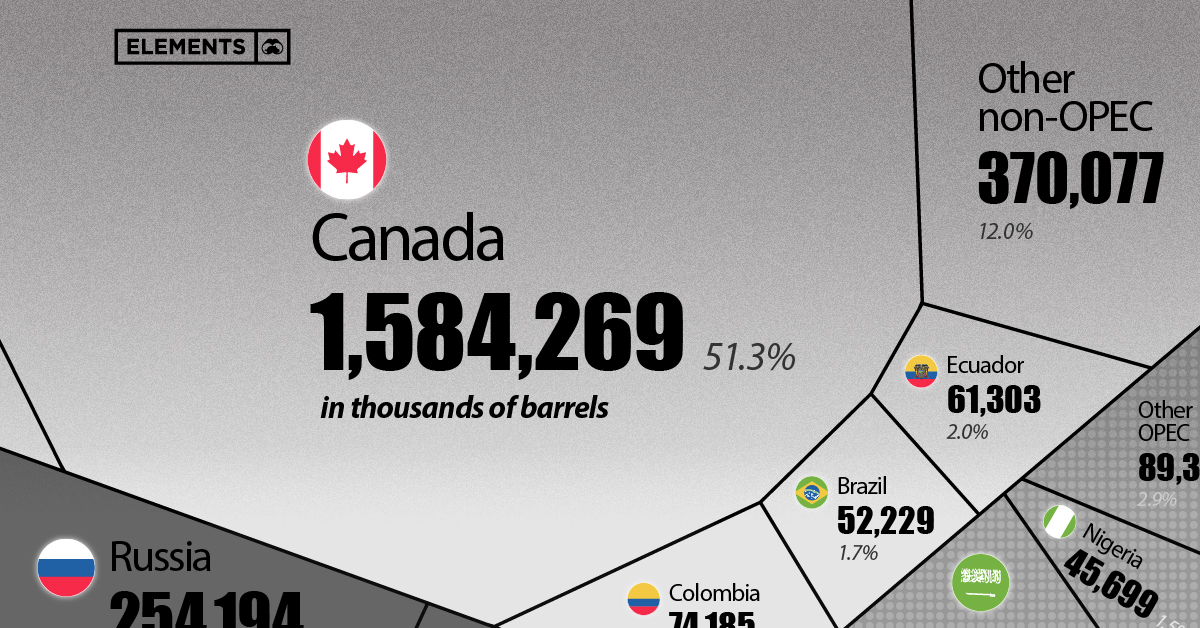
America’s northern neighbor, Canada, is the largest source of petroleum imports at 1.58 billion barrels in 2021. These made up more than 51% of U.S. petroleum imports, and when counting only crude oil imports, Canada’s share rises to 62%.
| Rank | Country | U.S. Oil Imports (2021, in barrels) | Share |
|---|---|---|---|
| #1 | 🇨🇦 Canada | 1,584 million | 51.3% |
| #2 | 🇲🇽 Mexico | 259 million | 8.4% |
| #3 | 🇷🇺 Russia | 254 million | 7.9% |
| #4 | 🇸🇦 Saudi Arabia | 156 million | 5.1% |
| #5 | 🇨🇴 Colombia | 74 million | 2.4% |
| #6 | 🇪🇨 Ecuador | 61 million | 2.0% |
| #7 | 🇮🇶 Iraq | 57 million | 1.9% |
| #8 | 🇧🇷 Brazil | 52 million | 1.7% |
| #9 | 🇰🇷 South Korea | 48 million | 1.6% |
| #10 | 🇳🇱 Netherlands | 46 million | 1.5% |
| #11 | 🇳🇬 Nigeria | 45 million | 1.5% |
| Other countries | 459 million | 14.7% | |
| Total | 3,091 million | 100.0% |
The second-largest contributor to U.S. petroleum imports was another neighbor, Mexico, with 259 million barrels imported in 2021—making up a bit more than 8% of U.S. petroleum imports.
Russia was the third-largest exporter of crude oil and petroleum products to the U.S. in 2021, with their 254 million barrels accounting for almost 8% of total imports.
U.S. Crude Oil and Petroleum Imports from OPEC and OPEC+
Only about 11% of U.S. crude oil and petroleum product imports come from OPEC nations, with another 16.3% coming from OPEC+ members.
While imports from OPEC and OPEC+ members make up more than a quarter of America’s total petroleum imports, this share is fairly small when considering OPEC members currently control nearly 80% of the world’s oil reserves.
Which Countries are Part of OPEC and OPEC-Plus?
The Organization of Petroleum Exporting Countries (OPEC) is a group of 13 petroleum producing nations that formed in 1960 to provide steady prices and supply distribution of crude oil and petroleum products.
In 2016, OPEC-plus was formed with additional oil-exporting nations in order to better control global oil supply and markets in response to a deluge of U.S. shale supply hitting the markets at that time.
OPEC members:
- 🇮🇷 Iran*
- 🇮🇶 Iraq*
- 🇰🇼 Kuwait*
- 🇸🇦 Saudi Arabia*
- 🇻🇪 Venezuela*
- 🇩🇿 Algeria
- 🇦🇴 Angola
- 🇬🇶 Equatorial Guinea
- 🇬🇦 Gabon
- 🇱🇾 Libya
- 🇳🇬 Nigeria
- 🇨🇩 Republic of the Congo
- 🇦🇪 United Arab Emirates
* Founding members
OPEC+ members:
- 🇷🇺 Russia
- 🇲🇽 Mexico
- 🇰🇿 Kazakhstan
- 🇲🇾 Malaysia
- 🇦🇿 Azerbaijan
- 🇧🇭 Bahrain
- 🇧🇳 Brunei
- 🇴🇲 Oman
- 🇸🇩 Sudan
- 🇸🇸 South Sudan
Although OPEC and OPEC+ members supply a significant part of U.S. crude oil and petroleum imports, America has avoided overdependence on the group by instead building strong ties with neighboring exporters Canada and Mexico.
Crude Oil Imports Capitalize on U.S. Refineries
While the U.S. has been a net exporter of crude oil and petroleum products the past two years, exporting 3.15 billion barrels while importing 3.09 billion barrels in 2021, crude oil-only trade tells a different story.
In terms of just crude oil trade, the U.S. was a significant net importer, with 2.23 billion barrels of crude oil imports and only 1.08 billion barrels of crude oil exports. But with the U.S. being the world’s largest crude oil producer, why is this?
As noted earlier, neighboring Canada makes up larger shares of U.S. crude oil imports compared to crude oil and petroleum product imports. Similarly, Mexico reaches 10% of America’s crude oil imports when excluding petroleum products.
Maximizing imports from neighboring countries makes sense on multiple fronts for all parties due to lower transportation costs and risks, and it’s no surprise Canada and Mexico are providing large shares of just crude oil as well. With such a large collection of oil refineries across the border, it’s ultimately more cost-efficient for Canada and Mexico to tap into U.S. oil refining rather than refining domestically.
In turn, Mexico is the largest importer of U.S. produced gasoline and diesel fuel, and Canada is the third-largest importer of American-produced refined petroleum products.
Replacing Russian Crude Oil Imports
While Russia only makes up 8% of American petroleum product imports, their 254 million barrels will need to be replaced as both countries ceased trading soon after Russia’s invasion of Ukraine.
In an effort to curb rising oil and gasoline prices, in March President Joe Biden announced the release of up to 180 million barrels from the U.S. Strategic Petroleum Reserves. Other IEA nations are also releasing emergency oil reserves in an attempt to curb rising prices at the pump and volatility in the oil market.
While the U.S. and the rest of the world are still managing the short-term solutions to this oil supply gap, the long-term solution is complex and has various moving parts. From ramping up domestic oil production to replacing oil demand with other cleaner energy solutions, oil trade and imports will remain a vital part of America’s energy supply.


Lithium
Ranked: The Top 10 EV Battery Manufacturers in 2023
Asia dominates this ranking of the world’s largest EV battery manufacturers in 2023.


The Top 10 EV Battery Manufacturers in 2023
This was originally posted on our Voronoi app. Download the app for free on iOS or Android and discover incredible data-driven charts from a variety of trusted sources.
Despite efforts from the U.S. and EU to secure local domestic supply, all major EV battery manufacturers remain based in Asia.
In this graphic we rank the top 10 EV battery manufacturers by total battery deployment (measured in megawatt-hours) in 2023. The data is from EV Volumes.
Chinese Dominance
Contemporary Amperex Technology Co. Limited (CATL) has swiftly risen in less than a decade to claim the title of the largest global battery group.
The Chinese company now has a 34% share of the market and supplies batteries to a range of made-in-China vehicles, including the Tesla Model Y, SAIC’s MG4/Mulan, and various Li Auto models.
| Company | Country | 2023 Production (megawatt-hour) | Share of Total Production |
|---|---|---|---|
| CATL | 🇨🇳 China | 242,700 | 34% |
| BYD | 🇨🇳 China | 115,917 | 16% |
| LG Energy Solution | 🇰🇷 Korea | 108,487 | 15% |
| Panasonic | 🇯🇵 Japan | 56,560 | 8% |
| SK On | 🇰🇷 Korea | 40,711 | 6% |
| Samsung SDI | 🇰🇷 Korea | 35,703 | 5% |
| CALB | 🇨🇳 China | 23,493 | 3% |
| Farasis Energy | 🇨🇳 China | 16,527 | 2% |
| Envision AESC | 🇨🇳 China | 8,342 | 1% |
| Sunwoda | 🇨🇳 China | 6,979 | 1% |
| Other | - | 56,040 | 8% |
In 2023, BYD surpassed LG Energy Solution to claim second place. This was driven by demand from its own models and growth in third-party deals, including providing batteries for the made-in-Germany Tesla Model Y, Toyota bZ3, Changan UNI-V, Venucia V-Online, as well as several Haval and FAW models.
The top three battery makers (CATL, BYD, LG) collectively account for two-thirds (66%) of total battery deployment.
Once a leader in the EV battery business, Panasonic now holds the fourth position with an 8% market share, down from 9% last year. With its main client, Tesla, now sourcing batteries from multiple suppliers, the Japanese battery maker seems to be losing its competitive edge in the industry.
Overall, the global EV battery market size is projected to grow from $49 billion in 2022 to $98 billion by 2029, according to Fortune Business Insights.

-

 Travel1 week ago
Airline Incidents: How Do Boeing and Airbus Compare?
-

 Markets2 weeks ago
Visualizing America’s Shortage of Affordable Homes
-

 Green2 weeks ago
Ranked: Top Countries by Total Forest Loss Since 2001
-

 Money2 weeks ago
Where Does One U.S. Tax Dollar Go?
-

 Misc2 weeks ago
Almost Every EV Stock is Down After Q1 2024
-

 AI2 weeks ago
The Stock Performance of U.S. Chipmakers So Far in 2024
-

 Markets2 weeks ago
Charted: Big Four Market Share by S&P 500 Audits
-

 Real Estate2 weeks ago
Ranked: The Most Valuable Housing Markets in America