Energy
Visualizing U.S. Consumption of Fuel and Materials per Capita
![]() Subscribe to the Elements free mailing list for more like this
Subscribe to the Elements free mailing list for more like this
Visualizing U.S. Consumption of Fuel and Materials per Capita
This was originally posted on Elements. Sign up to the free mailing list to get beautiful visualizations on natural resource megatrends in your email every week.
Wealthy countries consume massive amounts of natural resources per capita, and the United States is no exception.
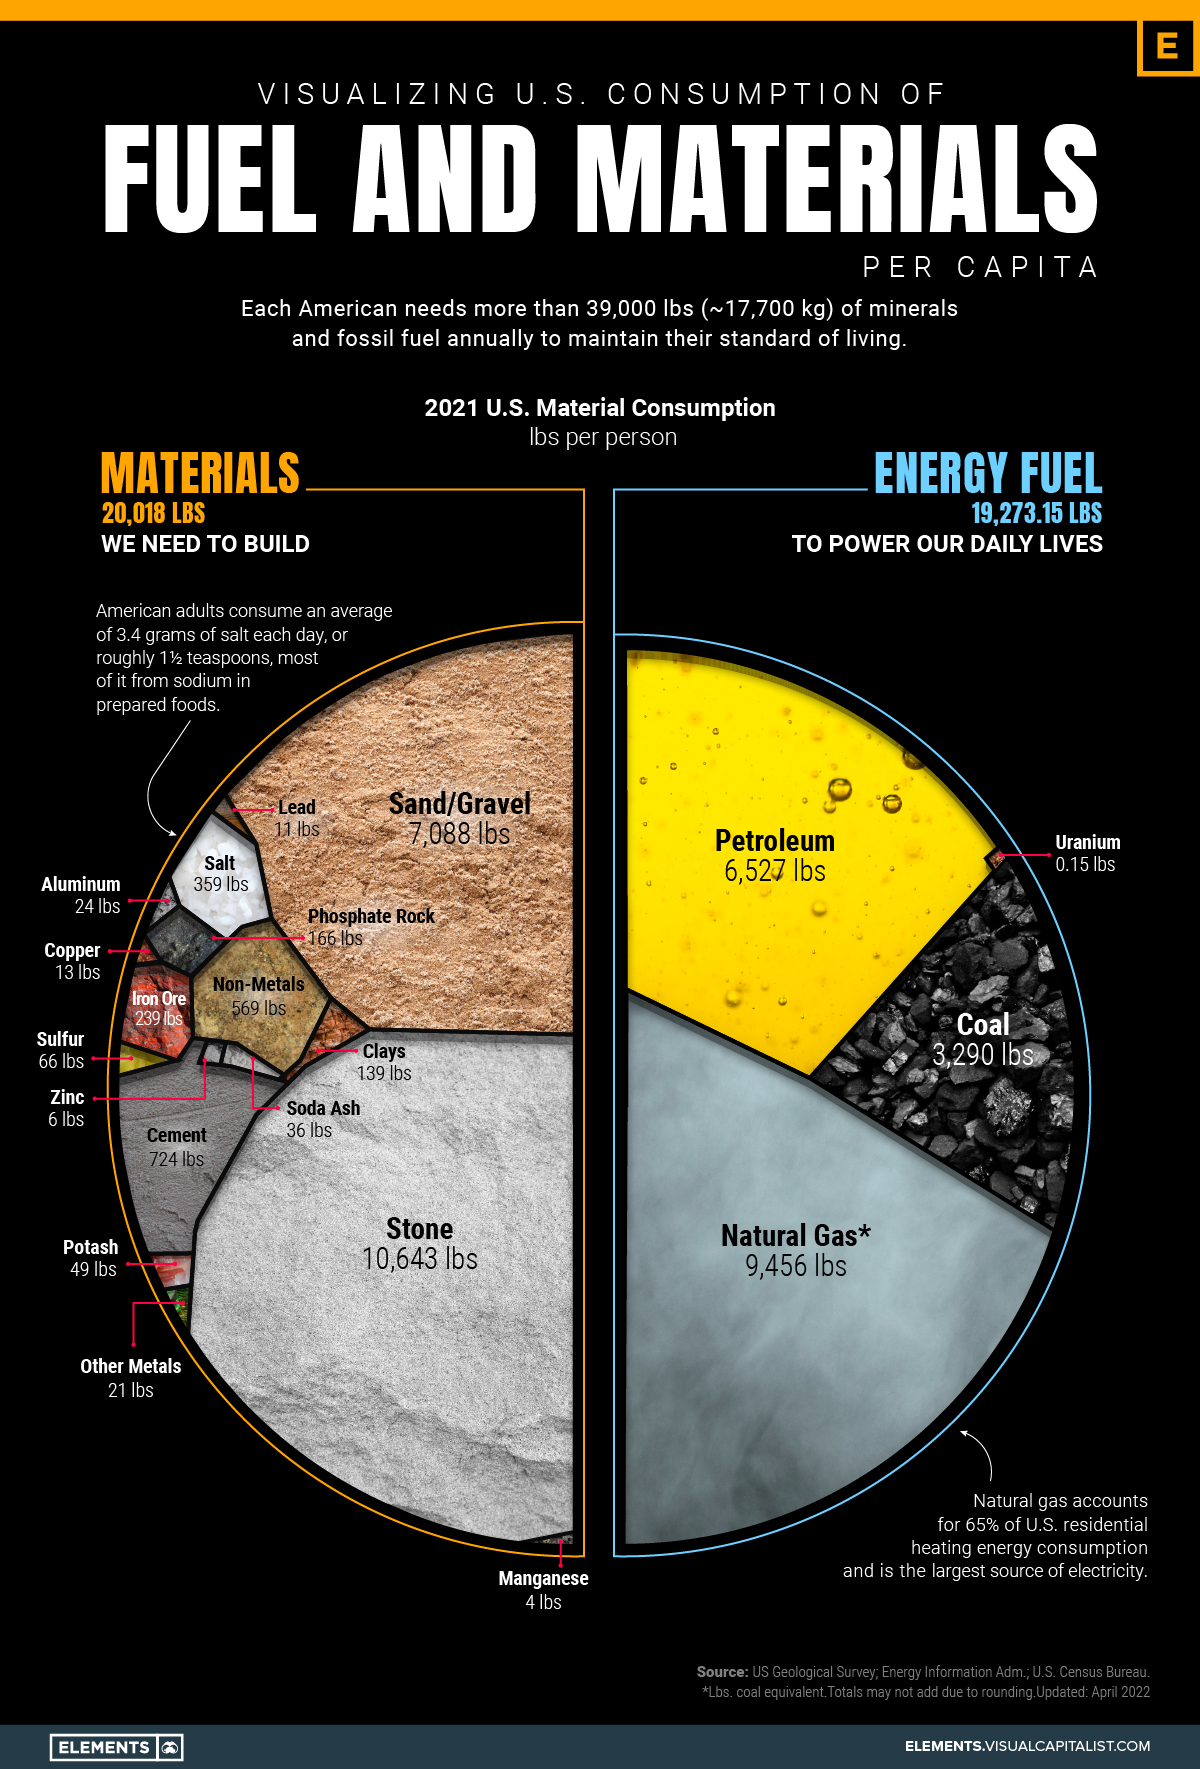
According to data from the National Mining Association, each American needs more than 39,000 pounds (17,700 kg) of minerals and fossil fuels annually to maintain their standard of living.
Materials We Need to Build
Every building around us and every sidewalk we walk on is made of sand, steel, and cement.
As a result, these materials lead consumption per capita in the United States. On average, each person in America drives the demand of over 10,000 lbs of stone and around 7,000 lbs of sand and gravel per year.
| Material/Fossil Fuel | Pounds Per Person |
|---|---|
| Stone | 10,643 |
| Natural Gas | 9,456 |
| Sand, Gravel | 7,088 |
| Petroleum Products | 6,527 |
| Coal | 3,290 |
| Cement | 724 |
| Other Nonmetals | 569 |
| Salt | 359 |
| Iron Ore | 239 |
| Phosphate Rock | 166 |
| Sulfur | 66 |
| Potash | 49 |
| Soda Ash | 36 |
| Bauxite (Aluminum) | 24 |
| Other Metals | 21 |
| Copper | 13 |
| Lead | 11 |
| Zinc | 6 |
| Manganese | 4 |
| Total | 39,291 |
The construction industry is a major contributor to the U.S. economy.
Crushed stone, sand, gravel, and other construction aggregates represent half of the industrial minerals produced in the country, resulting in $29 billion in revenue per year.
Also on the list are crucial hard metals such as copper, aluminum, iron ore, and of course many rarer metals used in smaller quantities each year. These rarer metals can make a big economic difference even when their uses are more concentrated and isolated—for example, palladium (primarily used in catalytic converters) costs $54 million per tonne.
Fuels Powering our Lives
Despite ongoing efforts to fight climate change and reduce carbon emissions, each person in the U.S. uses over 19,000 lbs of fossil fuels per year.
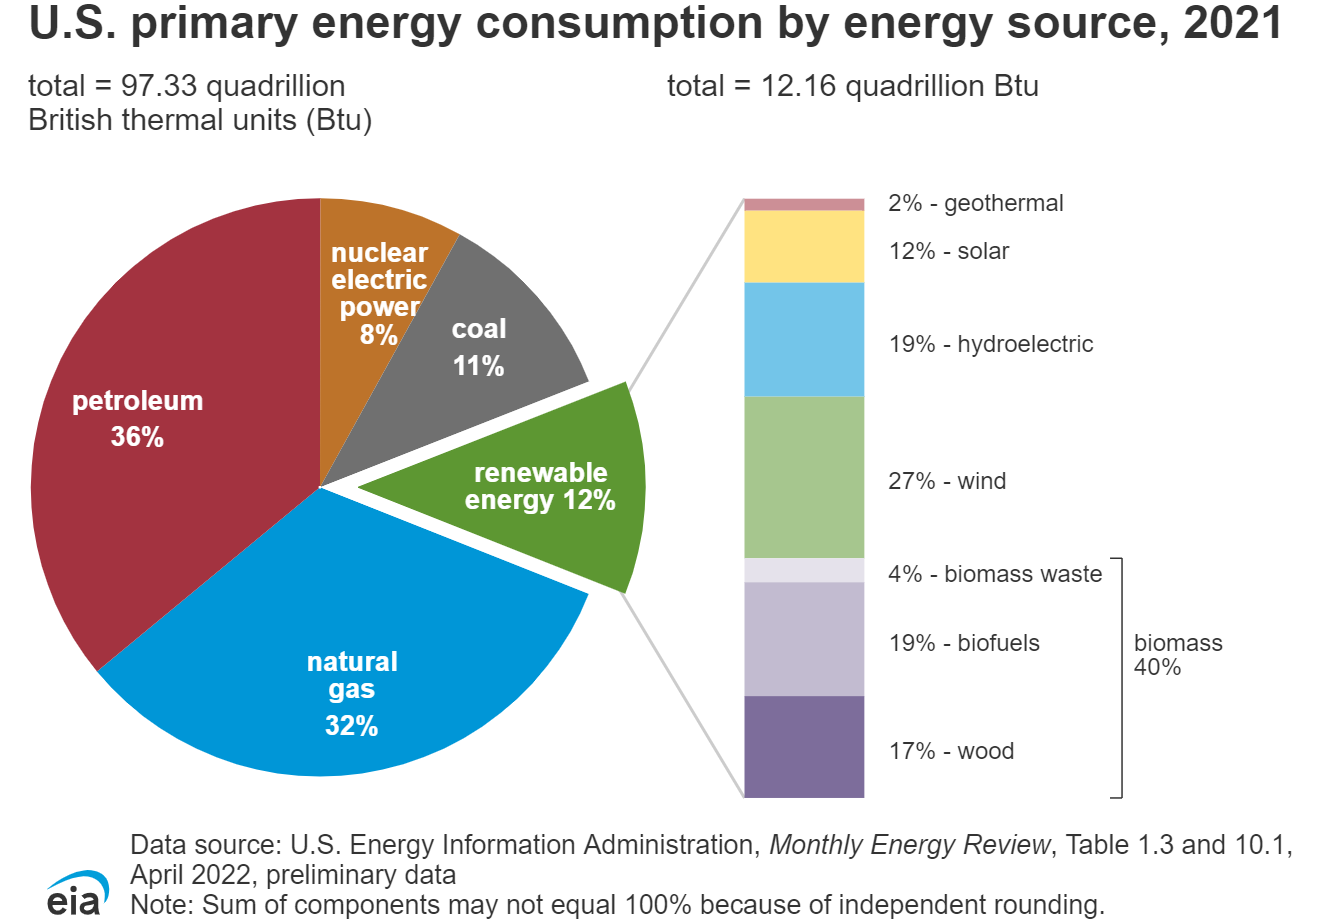
Gasoline is the most consumed petroleum product in the United States.
In 2021, finished motor gasoline consumption averaged about 369 million gallons per day, equal to about 44% of total U.S. petroleum use. Distillate fuel oil (20%), hydrocarbon gas liquids (17%), and jet fuel (7%) were the next most important uses.
Reliance on Other Countries
Over the past three decades, the United States has become reliant on foreign sources to meet domestic demand for minerals and fossil fuels. Today, the country is 100% import-reliant for 17 mineral commodities and at least 50% for 30 others.
In order to reduce the dependency on other countries, namely China, the Biden administration has been working to diversify supply chains in critical minerals. This includes strengthening alliances with other countries such as Australia, India, and Japan.
However, questions still remain about how soon these policies can make an impact, and the degree to which they can ultimately help localize and diversify supply chains.


Energy
The World’s Biggest Nuclear Energy Producers
China has grown its nuclear capacity over the last decade, now ranking second on the list of top nuclear energy producers.


The World’s Biggest Nuclear Energy Producers
This was originally posted on our Voronoi app. Download the app for free on Apple or Android and discover incredible data-driven charts from a variety of trusted sources.
Scientists in South Korea recently broke a record in a nuclear fusion experiment. For 48 seconds, they sustained a temperature seven times that of the sun’s core.
But generating commercially viable energy from nuclear fusion still remains more science fiction than reality. Meanwhile, its more reliable sibling, nuclear fission, has been powering our world for many decades.
In this graphic, we visualized the top producers of nuclear energy by their share of the global total, measured in terawatt hours (TWh). Data for this was sourced from the Nuclear Energy Institute, last updated in August 2022.
Which Country Generates the Most Nuclear Energy?
Nuclear energy production in the U.S. is more than twice the amount produced by China (ranked second) and France (ranked third) put together. In total, the U.S. accounts for nearly 30% of global nuclear energy output.
However, nuclear power only accounts for one-fifth of America’s electricity supply. This is in contrast to France, which generates 60% of its electricity from nuclear plants.
| Rank | Country | Nuclear Energy Produced (TWh) | % of Total |
|---|---|---|---|
| 1 | 🇺🇸 U.S. | 772 | 29% |
| 2 | 🇨🇳 China | 383 | 14% |
| 3 | 🇫🇷 France | 363 | 14% |
| 4 | 🇷🇺 Russia | 208 | 8% |
| 5 | 🇰🇷 South Korea | 150 | 6% |
| 6 | 🇨🇦 Canada | 87 | 3% |
| 7 | 🇺🇦 Ukraine | 81 | 3% |
| 8 | 🇩🇪 Germany | 65 | 2% |
| 9 | 🇯🇵 Japan | 61 | 2% |
| 10 | 🇪🇸 Spain | 54 | 2% |
| 11 | 🇸🇪 Sweden | 51 | 2% |
| 12 | 🇧🇪 Belgium | 48 | 2% |
| 13 | 🇬🇧 UK | 42 | 2% |
| 14 | 🇮🇳 India | 40 | 2% |
| 15 | 🇨🇿 Czech Republic | 29 | 1% |
| N/A | 🌐 Other | 219 | 8% |
| N/A | 🌍 Total | 2,653 | 100% |
Another highlight is how China has rapidly grown its nuclear energy capabilities in the last decade. Between 2016 and 2021, for example, it increased its share of global nuclear energy output from less than 10% to more than 14%, overtaking France for second place.
On the opposite end, the UK’s share has slipped to 2% over the same time period.
Meanwhile, Ukraine has heavily relied on nuclear energy to power its grid. In March 2022, it lost access to its key Zaporizhzhia Nuclear Power Station after Russian forces wrested control of the facility. With six 1,000 MW reactors, the plant is one of the largest in Europe. It is currently not producing any power, and has been the site of recent drone attacks.

-

 Real Estate2 weeks ago
Visualizing America’s Shortage of Affordable Homes
-

 Technology1 week ago
Ranked: Semiconductor Companies by Industry Revenue Share
-

 Money2 weeks ago
Which States Have the Highest Minimum Wage in America?
-

 Real Estate2 weeks ago
Ranked: The Most Valuable Housing Markets in America
-

 Business2 weeks ago
Charted: Big Four Market Share by S&P 500 Audits
-

 AI2 weeks ago
The Stock Performance of U.S. Chipmakers So Far in 2024
-

 Misc2 weeks ago
Almost Every EV Stock is Down After Q1 2024
-

 Money2 weeks ago
Where Does One U.S. Tax Dollar Go?