Investor Education
Visualizing The World’s Largest Sovereign Wealth Funds
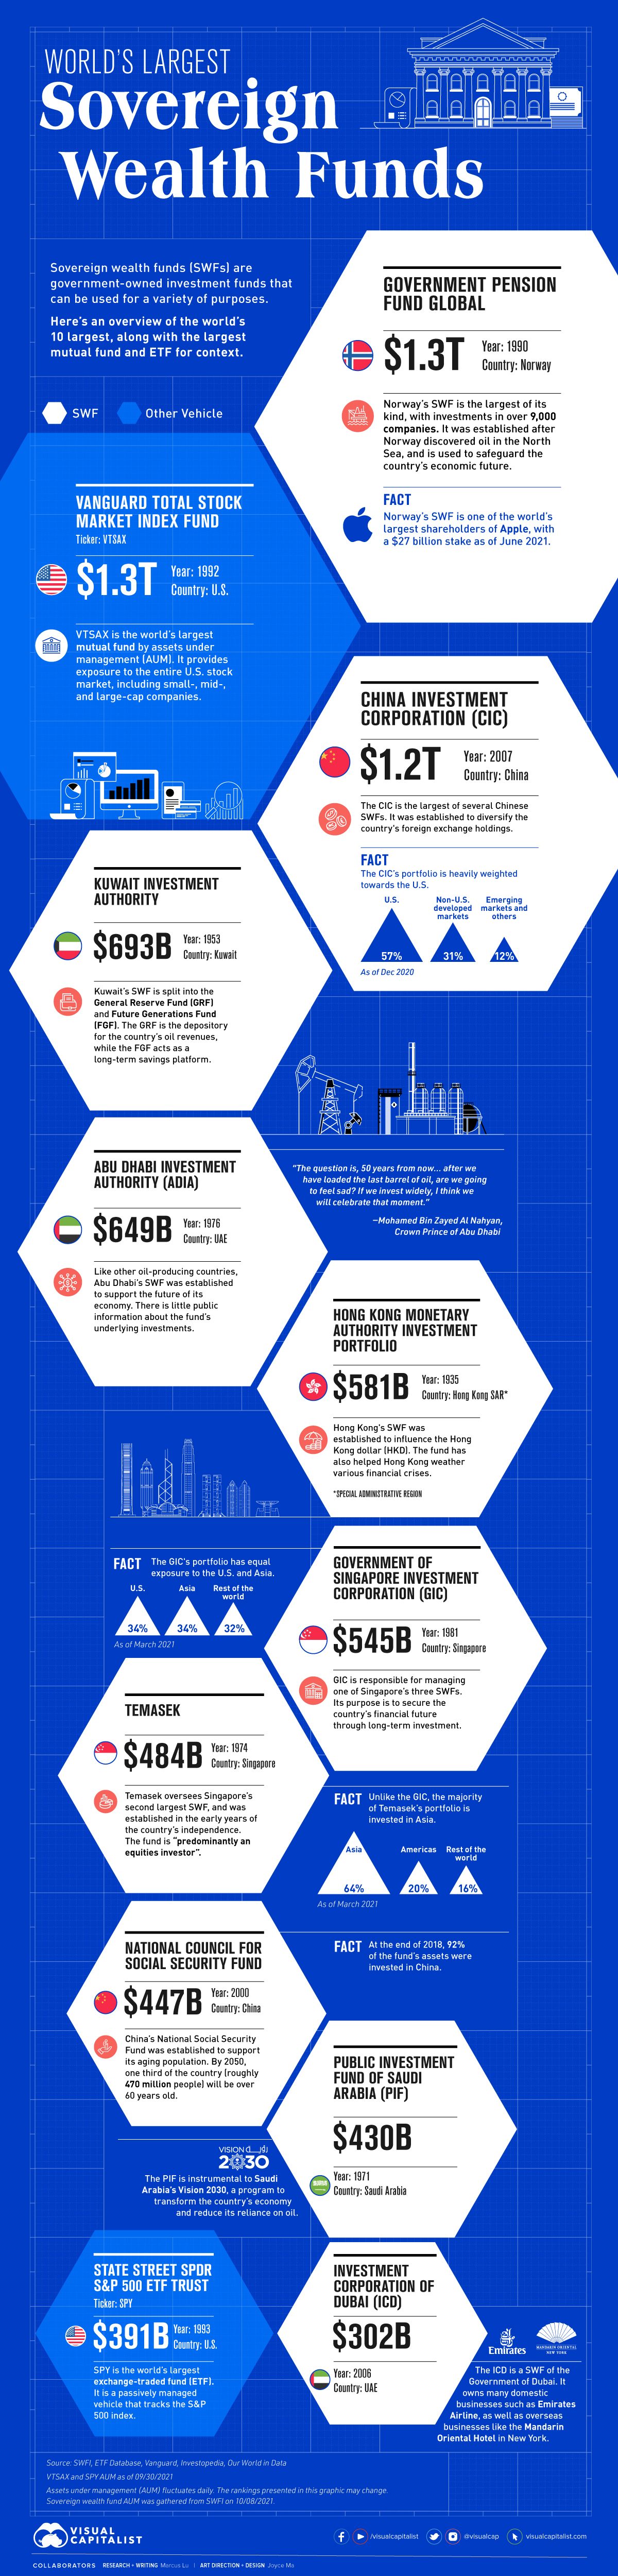


Visualized: The World’s Largest Sovereign Wealth Funds
Did you know that some of the world’s largest investment funds are owned by national governments?
Known as sovereign wealth funds (SWF), these vehicles are often established with seed money that is generated by government-owned industries. If managed responsibly and given a long enough timeframe, an SWF can accumulate an enormous amount of assets.
In this infographic, we’ve detailed the world’s 10 largest SWFs, along with the largest mutual fund and ETF for context.
The Big Picture
Data collected from SWFI in October 2021 ranks Norway’s Government Pension Fund Global (also known as the Norwegian Oil Fund) as the world’s largest SWF.
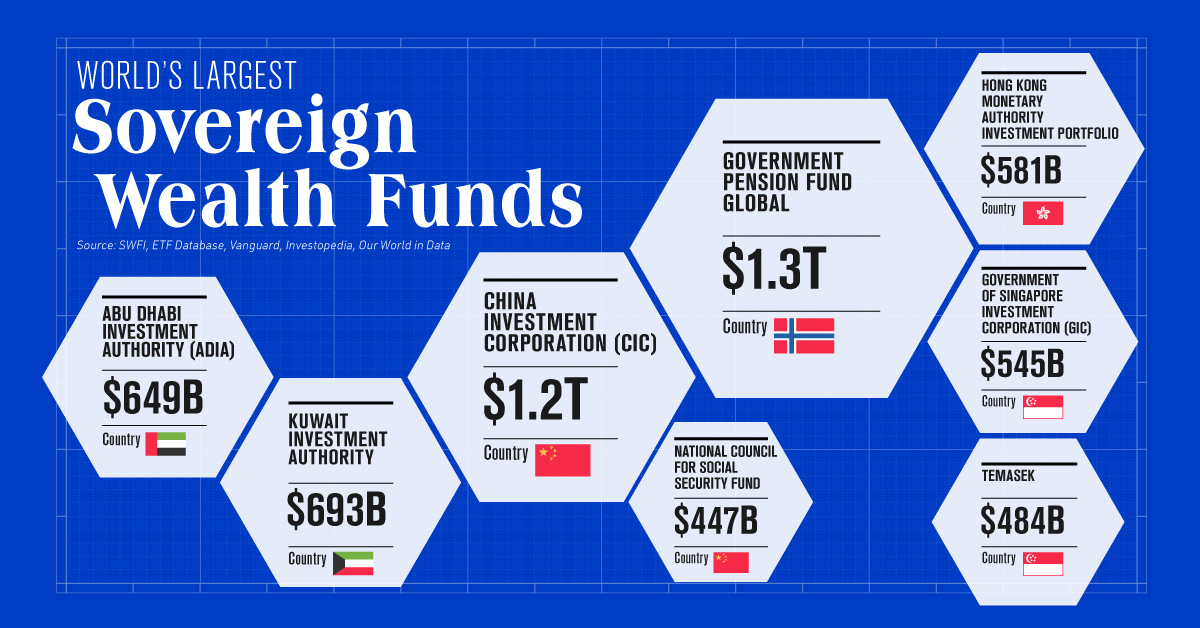
The world’s 10 largest sovereign wealth funds (with fund size benchmarks) are listed below:
| Country | Fund Name | Fund Type | Assets Under Management (AUM) |
|---|---|---|---|
| 🇳🇴 Norway | Government Pension Fund Global | SWF | $1.3 trillion |
| 🇺🇸 U.S. | Vanguard Total Stock Market Index Fund | Mutual fund | $1.3 trillion |
| 🇨🇳 China | China Investment Corporation | SWF | $1.2 trillion |
| 🇰🇼 Kuwait | Kuwait Investment Authority | SWF | $693 billion |
| 🇦🇪 United Arab Emirates | Abu Dhabi Investment Authority | SWF | $649 billion |
| 🇭🇰 Hong Kong SAR | Hong Kong Monetary Authority Investment Portfolio | SWF | $581 billion |
| 🇸🇬 Singapore | Government of Singapore Investment Corporation | SWF | $545 billion |
| 🇸🇬 Singapore | Temasek | SWF | $484 billion |
| 🇨🇳 China | National Council for Social Security Fund | SWF | $447 billion |
| 🇸🇦 Saudi Arabia | Public Investment Fund of Saudi Arabia | SWF | $430 billion |
| 🇺🇸 U.S. | State Street SPDR S&P 500 ETF Trust | ETF | $391 billion |
| 🇦🇪 United Arab Emirates | Investment Corporation of Dubai | SWF | $302 billion |
SWF AUM gathered on 10/08/2021. VTSAX and SPY AUM as of 09/30/2021.
So far, just two SWFs have surpassed the $1 trillion milestone. To put this in perspective, consider that the world’s largest mutual fund, the Vanguard Total Stock Market Index Fund (VTSAX), is a similar size, investing in U.S. large-, mid-, and small-cap equities.
The Trillion Dollar Club
The world’s two largest sovereign wealth funds have a combined $2.5 trillion in assets. Here’s a closer look at their underlying portfolios.
1. Government Pension Fund Global – $1.3 Trillion (Norway)
Norway’s SWF was established after the country discovered oil in the North Sea. The fund invests the revenue coming from this sector to safeguard the future of the national economy. Here’s a breakdown of its investments.
| Asset Class | % of Total Assets | Country Diversification | Number of Securities |
|---|---|---|---|
| Public Equities | 72.8% | 69 countries | 9,123 companies |
| Fixed income | 24.7% | 45 countries | 1,245 bonds |
| Real estate | 2.5% | 14 countries | 867 properties |
As of 12/31/2020
Real estate may be a small part of the portfolio, but it’s an important component for diversification (real estate is less correlated to the stock market) and generating income. Here are some U.S. office towers that the fund has an ownership stake in.
| Address | Ownership Stake |
|---|---|
| 601 Lexington Avenue, New York, NY | 45.0% |
| 475 Fifth Avenue, New York, NY | 49.9% |
| 33 Arch Street, Boston, MA | 49.9% |
| 100 First Street, San Francisco, CA | 44.0% |
As of 12/31/2020
Overall, the fund has investments in 462 properties in the U.S. for a total value of $14.9 billion.
2. China Investment Corporation (CIC) – $1.2 Trillion (China)
The CIC is the largest of several Chinese SWFs, and was established to diversify the country’s foreign exchange holdings.
Compared to the Norwegian fund, the CIC invests in a greater variety of alternatives. This includes real estate, of course, but also private equity, private credit, and hedge funds.
| Asset Class | % of Total Assets |
|---|---|
| Public equities | 38% |
| Fixed income | 17% |
| Alternative assets | 43% |
| Cash | 2% |
As of 12/31/2020
A primary focus of the CIC has been to increase its exposure to American infrastructure and manufacturing. By the end of 2020, 57% of the fund was invested in the United States.
“According to our estimate, the United States needs at least $8 trillion in infrastructure investments. There’s not sufficient capital from the U.S. government or private sector. It has to rely on foreign investments.”
– Ding Xuedong, Chairman, China Investment Corporation
This has drawn suspicion from U.S. regulators given the geopolitical tensions between the two countries. For further reading on the topic, consider this 2017 paper by the United States-China Economic and Security Review Commission.
Preparing for a Future Without Oil
Many of the countries associated with these SWFs are known for their robust fossil fuel industries. This includes Middle Eastern nations like Kuwait, Saudi Arabia, and the United Arab Emirates.
Oil has been an incredible source of wealth for these countries, but it’s unlikely to last forever. Some analysts believe that we could even see peak oil demand before 2030—though this doesn’t mean that oil will stop being an important resource.
Regardless, oil-producing countries are looking to hedge their reliance on fossil fuels. Their SWFs play an important role by taking oil revenue and investing it to generate returns and/or bolster other sectors of the economy.
An example of this is Saudi Arabia’s Public Investment Fund (PIF), which supports the country’s Vision 2030 framework by investing in clean energy and other promising sectors.


Investor Education
How MSCI Builds Thematic Indexes: A Step-by-Step Guide
From developing an index objective to choosing relevant stocks, this graphic breaks down how MSCI builds thematic indexes using examples.


How MSCI Builds Thematic Indexes: A Step-by-Step Guide
Have you ever wondered how MSCI builds its thematic indexes?
To capture long-term, structural trends that could drive business performance in the future, the company follows a systematic approach. This graphic from MSCI breaks down each step in the process used to create its thematic indexes.
Step 1: Develop an Index Objective
MSCI first builds a broad statement of what the theme aims to capture based on extensive research and insights from industry experts.
Steps 2 and 3: List Sub-Themes, Generate Keyword List
Together with experts, MSCI creates a list of sub-themes or “seedwords” to identify aligned business activities.
The team then assembles a collection of suitable documents describing the theme. Natural language processing efficiently analyzes word frequency and relevance to generate a more detailed set of keywords contextually similar to the seedwords.
Step 4: Find Relevant Companies
By analyzing financial reports, MSCI picks companies relevant to the theme using two methods:
- Direct approach: Revenue from a company’s business segment is considered 100% relevant if the segment name matches a theme keyword. Standard Industrial Classification (SIC) codes from these directly-matched segments make up the eligible SIC code list used in the indirect approach.
- Indirect approach: If a segment name doesn’t match theme keywords, MSCI will:
- Analyze the density of theme keywords mentioned in the company’s description. A minimum of two unique keywords is required.
- The keyword density determines a “discount factor” to reflect lower certainty in theme alignment.
- Revenue from business segments with an eligible SIC code, regardless of how they are named, is scaled down by the discount factor.
The total percentage of revenue applicable to the theme from both approaches determines a company’s relevance score.
Step 5: Select the Stocks
Finally, MSCI narrows down the stocks that will be included:
- Global parent universe: The ACWI Investable Market Index (IMI) is the starting point for standard thematic indexes.
- Relevance filter: The universe is filtered for companies with a relevance score of at least 25%.
- False positive control: Eligible companies that are mapped to un-related GICS sub-industries are removed.
Companies with higher relevance scores and market caps have a higher weighting in the index, with the maximum weighting for any one issuer capped at 5%. The final selected stocks span various sectors.
MSCI Thematic Indexes: Regularly Updated and Rules-Based
Once an index is built, it is reviewed semi-annually and updated based on:
- Changes to the parent index
- Changes at individual companies
- Theme developments based on expert input
Theme keywords are reviewed yearly in May. Overall, MSCI’s thematic index construction process is objective, scalable, and flexible. The process can be customized based on the theme(s) you want to capture.
Learn more about MSCI’s thematic indexes.

-

 Investor Education5 months ago
The 20 Most Common Investing Mistakes, in One Chart
Here are the most common investing mistakes to avoid, from emotionally-driven investing to paying too much in fees.
-

 Stocks10 months ago
Visualizing BlackRock’s Top Equity Holdings
BlackRock is the world’s largest asset manager, with over $9 trillion in holdings. Here are the company’s top equity holdings.
-

 Investor Education10 months ago
10-Year Annualized Forecasts for Major Asset Classes
This infographic visualizes 10-year annualized forecasts for both equities and fixed income using data from Vanguard.
-

 Investor Education1 year ago
Visualizing 90 Years of Stock and Bond Portfolio Performance
How have investment returns for different portfolio allocations of stocks and bonds compared over the last 90 years?
-

 Debt2 years ago
Countries with the Highest Default Risk in 2022
In this infographic, we examine new data that ranks the top 25 countries by their default risk.
-

 Markets2 years ago
The Best Months for Stock Market Gains
This infographic analyzes over 30 years of stock market performance to identify the best and worst months for gains.


-

 Maps2 weeks ago
Mapped: Average Wages Across Europe
-

 Money1 week ago
Which States Have the Highest Minimum Wage in America?
-

 Real Estate1 week ago
Ranked: The Most Valuable Housing Markets in America
-

 Markets1 week ago
Charted: Big Four Market Share by S&P 500 Audits
-

 AI1 week ago
The Stock Performance of U.S. Chipmakers So Far in 2024
-

 Automotive1 week ago
Almost Every EV Stock is Down After Q1 2024
-

 Money2 weeks ago
Where Does One U.S. Tax Dollar Go?
-

 Green2 weeks ago
Ranked: Top Countries by Total Forest Loss Since 2001