Energy
Visualizing the World’s Largest Oil Producers
![]() Subscribe to the Elements free mailing list for more like this
Subscribe to the Elements free mailing list for more like this


The World’s Largest Oil Producers
This was originally posted on Elements. Sign up to the free mailing list to get beautiful visualizations on natural resource megatrends in your email every week.
The world is in the middle of the first energy crisis of the 21st century.
High energy prices, especially for oil, gas, and coal, are driving decades-high inflation in various countries, some of which are also experiencing energy shortages. Russia’s recent invasion of Ukraine has exacerbated the crisis, given that the country is both a major producer and exporter of oil and natural gas.
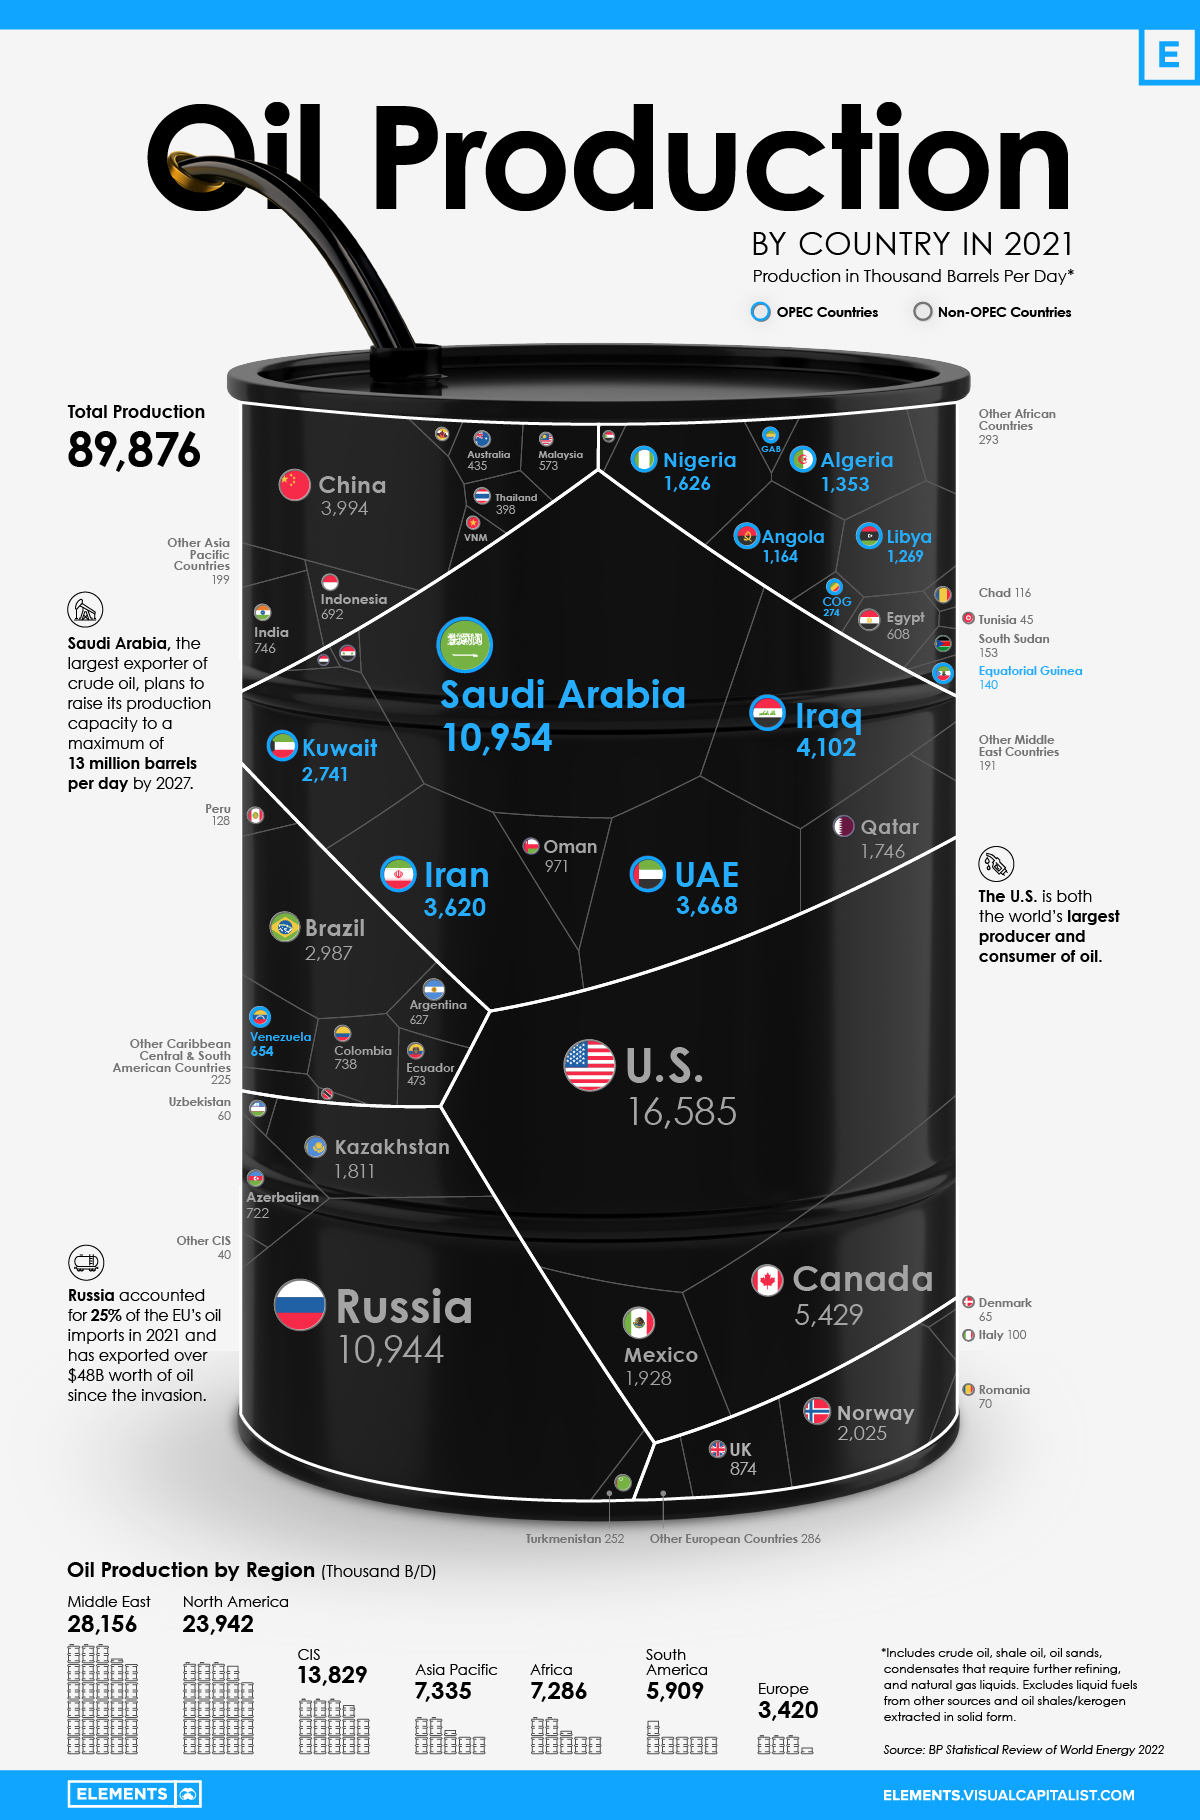
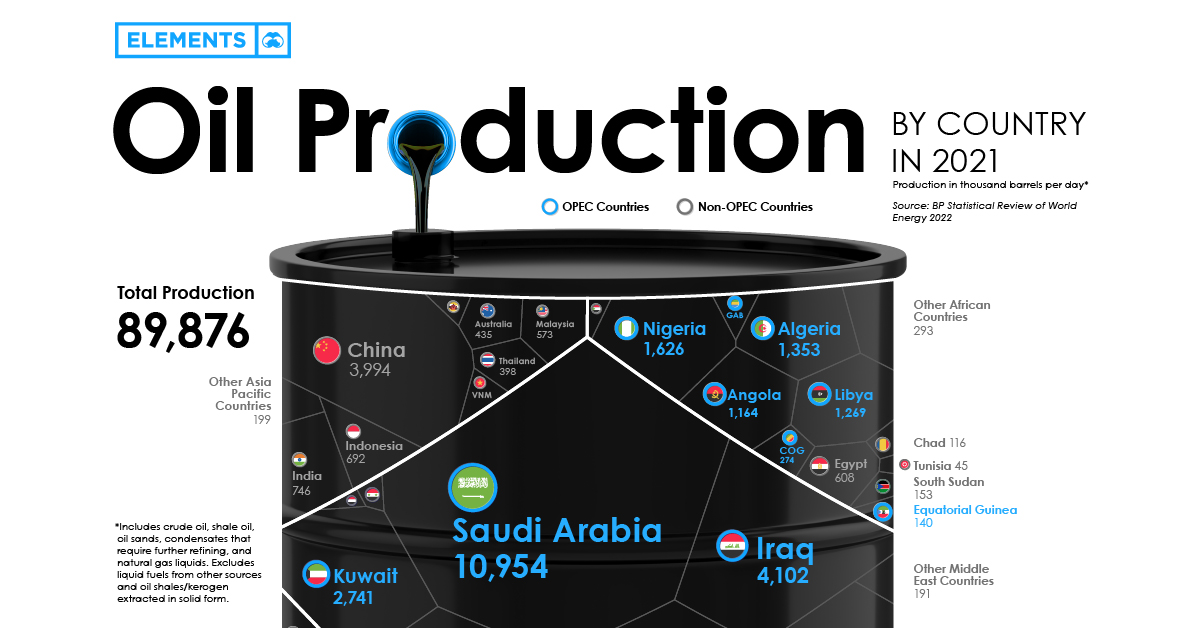
Using data from BP’s Statistical Review of World Energy, the above infographic provides further context on the crisis by visualizing the world’s largest oil producers in 2021.
Oil Production: OPEC Countries vs. Rest of the World
Before looking at country-level data, it’s worth seeing the amount of oil the Organization of Petroleum Exporting Countries (OPEC) produces compared to other organizations and regions.
| Region/Organization | 2021 Oil Production (barrels per day) | % of Total |
|---|---|---|
| OPEC | 31.7M | 35% |
| North America | 23.9M | 27% |
| Commonwealth of Independent States (CIS) | 13.8M | 15% |
| Rest of the World | 20.5M | 23% |
| Total | 89.9M | 100% |
The OPEC countries are the largest oil producers collectively, with Saudi Arabia alone making up one-third of OPEC production. It’s also important to note that OPEC production remains below pre-pandemic levels after the organization reduced its output by an unprecedented 10 million barrels per day (B/D) in 2020.
Following the OPEC countries, the U.S., Canada, and Mexico accounted for just over a quarter of global oil production in 2021. Nearly 70% of North American oil production came from the U.S., the world’s largest oil producer.
Similarly, within the CIS—an organization of post-Soviet Union countries—Russia was by far the largest producer, accounting for 80% of total CIS production.
The Largest Oil Producers in 2021
Roughly 43% of the world’s oil production came from just three countries in 2021—the U.S., Saudi Arabia, and Russia. Together, these three countries produced more oil than the rest of the top 10 combined.
| Country | 2021 Oil Production (barrels per day) | % of Total |
|---|---|---|
| U.S. 🇺🇸 | 16.6M | 18.5% |
| Saudi Arabia 🇸🇦 | 11M | 12.2% |
| Russian Federation 🇷🇺 | 10.9M | 12.2% |
| Canada 🇨🇦 | 5.4M | 6.0% |
| Iraq 🇮🇶 | 4.1M | 4.6% |
| China 🇨🇳 | 4.0M | 4.4% |
| United Arab Emirates 🇦🇪 | 3.7M | 4.1% |
| Iran 🇮🇷 | 3.6M | 4.0% |
| Brazil 🇧🇷 | 3.0M | 3.3% |
| Kuwait 🇰🇼 | 2.7M | 3.0% |
| Norway 🇳🇴 | 2.0M | 2.3% |
| Mexico 🇲🇽 | 1.9M | 2.1% |
| Kazakhstan 🇰🇿 | 1.8M | 2.0% |
| Qatar 🇶🇦 | 1.7M | 1.9% |
| Nigeria 🇳🇬 | 1.6M | 1.8% |
| Algeria 🇩🇿 | 1.4M | 1.5% |
| Libya 🇱🇾 | 1.3M | 1.4% |
| Angola 🇦🇴 | 1.2M | 1.3% |
| Oman 🇴🇲 | 0.97M | 1.1% |
| United Kingdom 🇬🇧 | 0.87M | 1.0% |
| India 🇮🇳 | 0.75M | 0.8% |
| Colombia 🇨🇴 | 0.74M | 0.8% |
| Azerbaijan 🇦🇿 | 0.72M | 0.8% |
| Indonesia 🇮🇩 | 0.69M | 0.8% |
| Venezuela 🇻🇪 | 0.65M | 0.7% |
| Argentina 🇦🇷 | 0.63M | 0.7% |
| Egypt 🇪🇬 | 0.60M | 0.7% |
| Malaysia 🇲🇾 | 0.57M | 0.6% |
| Ecuador 🇪🇨 | 0.47M | 0.5% |
| Australia 🇦🇺 | 0.44M | 0.5% |
| Thailand 🇹🇭 | 0.39M | 0.4% |
| Republic of Congo 🇨🇬 | 0.27M | 0.3% |
| Turkmenistan 🇹🇲 | 0.25M | 0.3% |
| Vietnam 🇻🇳 | 0.19M | 0.2% |
| Gabon 🇬🇦 | 0.18M | 0.2% |
| South Sudan 🇸🇩 | 0.15M | 0.2% |
| Equatorial Guinea 🇬🇳 | 0.14M | 0.2% |
| Peru 🇵🇪 | 0.13M | 0.1% |
| Chad 🇹🇩 | 0.12M | 0.1% |
| Brunei 🇧🇳 | 0.10M | 0.1% |
| Italy 🇮🇹 | 0.10M | 0.1% |
| Syria 🇸🇾 | 0.10M | 0.1% |
| Trinidad & Tobago 🇹🇹 | 0.08M | 0.1% |
| Romania 🇷🇴 | 0.07M | 0.1% |
| Yemen 🇾🇪 | 0.07M | 0.1% |
| Denmark 🇩🇰 | 0.07M | 0.1% |
| Sudan 🇸🇩 | 0.06M | 0.1% |
| Uzbekistan 🇺🇿 | 0.06M | 0.1% |
| Tunisia 🇹🇳 | 0.05M | 0.1% |
| Rest of the World 🌍 | 1.2M | 1.4% |
| Total | 89.9M | 100.0% |
Over the last few decades, U.S. oil production has been on a rollercoaster of troughs and peaks. After falling from its 1970 peak of 11.3 million B/D, it reached a historic low of 6.8 million B/D in 2008. However, following a turnaround in the 2010s, the country has since surpassed Saudi Arabia as the largest oil producer. As of 2021, though, the U.S. remained a net importer of crude oil while exporting refined petroleum products.
Saudi Arabia and Russia each produced roughly 11 million B/D in 2021 and were the two largest oil exporters globally. In both countries, state-owned oil firms (Saudi Aramco and Gazprom, respectively) were the most valuable oil and gas producing companies.
From Europe (excluding Russia), only Norway made the top 15 oil producers, accounting for 2.3% of global production. The lack of regional output partly explains the European Union’s dependence on Russian oil and gas, worsening the region’s energy crisis.
How the Energy Crisis is Affecting Oil Production
After a deep dive in 2020, oil demand is resurfacing and is now above pre-pandemic levels. Furthermore, supply constraints due to sanctions on Russian oil and gas tighten the market and support high oil prices.
While the impact has been felt globally, European countries have been hit hard due to their reliance on Russia’s fossil fuel exports, with some getting almost all of their energy fuels from Russia.
To combat the oil crunch, the rest of the world is ramping up oil supply through increased production or releasing strategic petroleum reserves (SPRs). U.S. oil production is expected to rise by 1 million B/D in 2022 to a record-high. Simultaneously, Western nations are calling on OPEC members to increase their output to ease prices. However, OPEC nations are sticking to their planned production hikes, with output still below early 2020 levels.
“We had a good discussion on ensuring global energy security and adequate oil supplies to support global economic growth. And that will begin shortly.”– U.S. President Joe Biden on his recent visit to Saudi Arabia
The U.S. is releasing 180 million barrels of oil from its SPR, of which 60 million barrels will contribute to the IEA’s collective release of 120 million barrels. But with oil demand expected to reach a new all-time high in 2023, it remains to be seen whether these efforts to increase supply will be enough to curb the crunch.


Energy
The World’s Biggest Nuclear Energy Producers
China has grown its nuclear capacity over the last decade, now ranking second on the list of top nuclear energy producers.


The World’s Biggest Nuclear Energy Producers
This was originally posted on our Voronoi app. Download the app for free on Apple or Android and discover incredible data-driven charts from a variety of trusted sources.
Scientists in South Korea recently broke a record in a nuclear fusion experiment. For 48 seconds, they sustained a temperature seven times that of the sun’s core.
But generating commercially viable energy from nuclear fusion still remains more science fiction than reality. Meanwhile, its more reliable sibling, nuclear fission, has been powering our world for many decades.
In this graphic, we visualized the top producers of nuclear energy by their share of the global total, measured in terawatt hours (TWh). Data for this was sourced from the Nuclear Energy Institute, last updated in August 2022.
Which Country Generates the Most Nuclear Energy?
Nuclear energy production in the U.S. is more than twice the amount produced by China (ranked second) and France (ranked third) put together. In total, the U.S. accounts for nearly 30% of global nuclear energy output.
However, nuclear power only accounts for one-fifth of America’s electricity supply. This is in contrast to France, which generates 60% of its electricity from nuclear plants.
| Rank | Country | Nuclear Energy Produced (TWh) | % of Total |
|---|---|---|---|
| 1 | 🇺🇸 U.S. | 772 | 29% |
| 2 | 🇨🇳 China | 383 | 14% |
| 3 | 🇫🇷 France | 363 | 14% |
| 4 | 🇷🇺 Russia | 208 | 8% |
| 5 | 🇰🇷 South Korea | 150 | 6% |
| 6 | 🇨🇦 Canada | 87 | 3% |
| 7 | 🇺🇦 Ukraine | 81 | 3% |
| 8 | 🇩🇪 Germany | 65 | 2% |
| 9 | 🇯🇵 Japan | 61 | 2% |
| 10 | 🇪🇸 Spain | 54 | 2% |
| 11 | 🇸🇪 Sweden | 51 | 2% |
| 12 | 🇧🇪 Belgium | 48 | 2% |
| 13 | 🇬🇧 UK | 42 | 2% |
| 14 | 🇮🇳 India | 40 | 2% |
| 15 | 🇨🇿 Czech Republic | 29 | 1% |
| N/A | 🌐 Other | 219 | 8% |
| N/A | 🌍 Total | 2,653 | 100% |
Another highlight is how China has rapidly grown its nuclear energy capabilities in the last decade. Between 2016 and 2021, for example, it increased its share of global nuclear energy output from less than 10% to more than 14%, overtaking France for second place.
On the opposite end, the UK’s share has slipped to 2% over the same time period.
Meanwhile, Ukraine has heavily relied on nuclear energy to power its grid. In March 2022, it lost access to its key Zaporizhzhia Nuclear Power Station after Russian forces wrested control of the facility. With six 1,000 MW reactors, the plant is one of the largest in Europe. It is currently not producing any power, and has been the site of recent drone attacks.

-

 Real Estate2 weeks ago
Visualizing America’s Shortage of Affordable Homes
-

 Technology1 week ago
Ranked: Semiconductor Companies by Industry Revenue Share
-

 Money1 week ago
Which States Have the Highest Minimum Wage in America?
-

 Real Estate1 week ago
Ranked: The Most Valuable Housing Markets in America
-

 Business2 weeks ago
Charted: Big Four Market Share by S&P 500 Audits
-

 AI2 weeks ago
The Stock Performance of U.S. Chipmakers So Far in 2024
-

 Misc2 weeks ago
Almost Every EV Stock is Down After Q1 2024
-

 Money2 weeks ago
Where Does One U.S. Tax Dollar Go?