Energy
Visualizing the World’s Largest Oil Producers
![]() Subscribe to the Elements free mailing list for more like this
Subscribe to the Elements free mailing list for more like this


The World’s Largest Oil Producers
This was originally posted on Elements. Sign up to the free mailing list to get beautiful visualizations on natural resource megatrends in your email every week.
The world is in the middle of the first energy crisis of the 21st century.
High energy prices, especially for oil, gas, and coal, are driving decades-high inflation in various countries, some of which are also experiencing energy shortages. Russia’s recent invasion of Ukraine has exacerbated the crisis, given that the country is both a major producer and exporter of oil and natural gas.
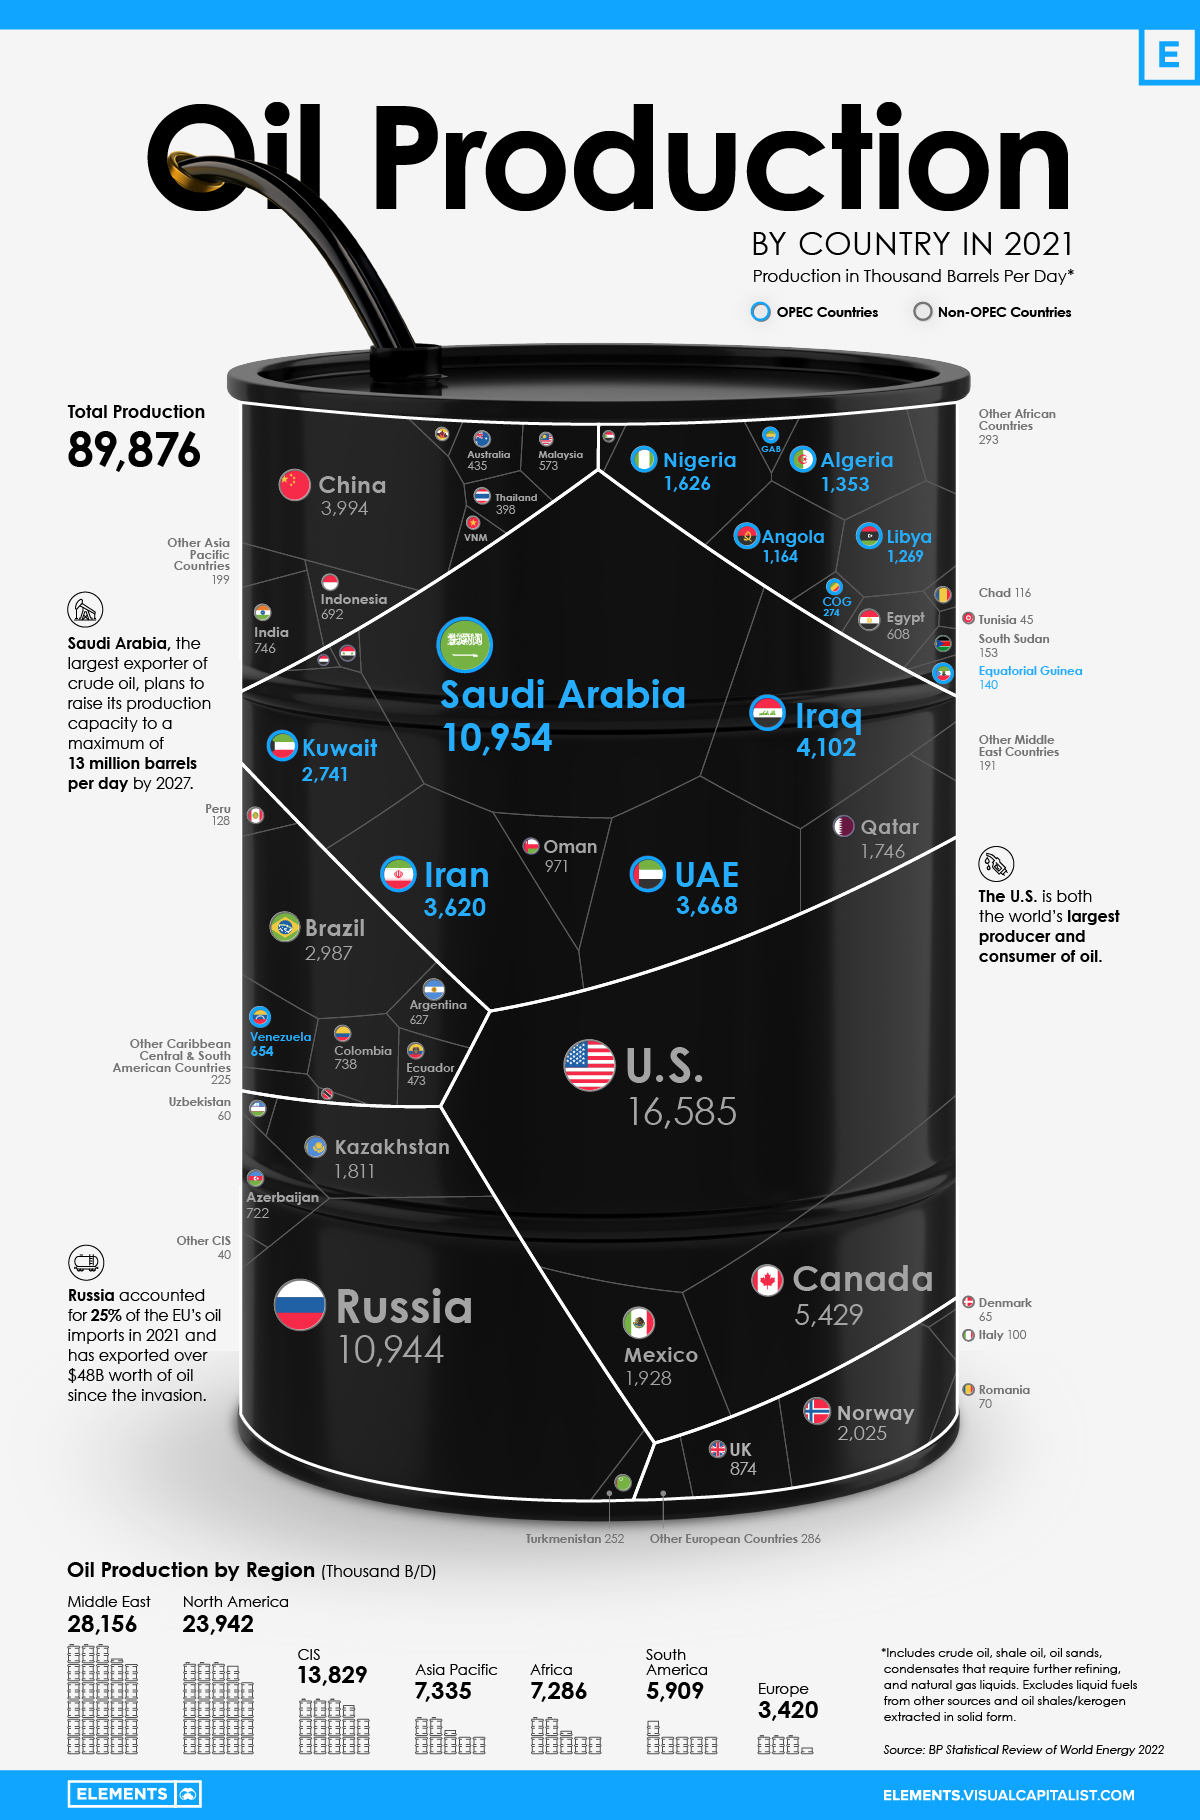
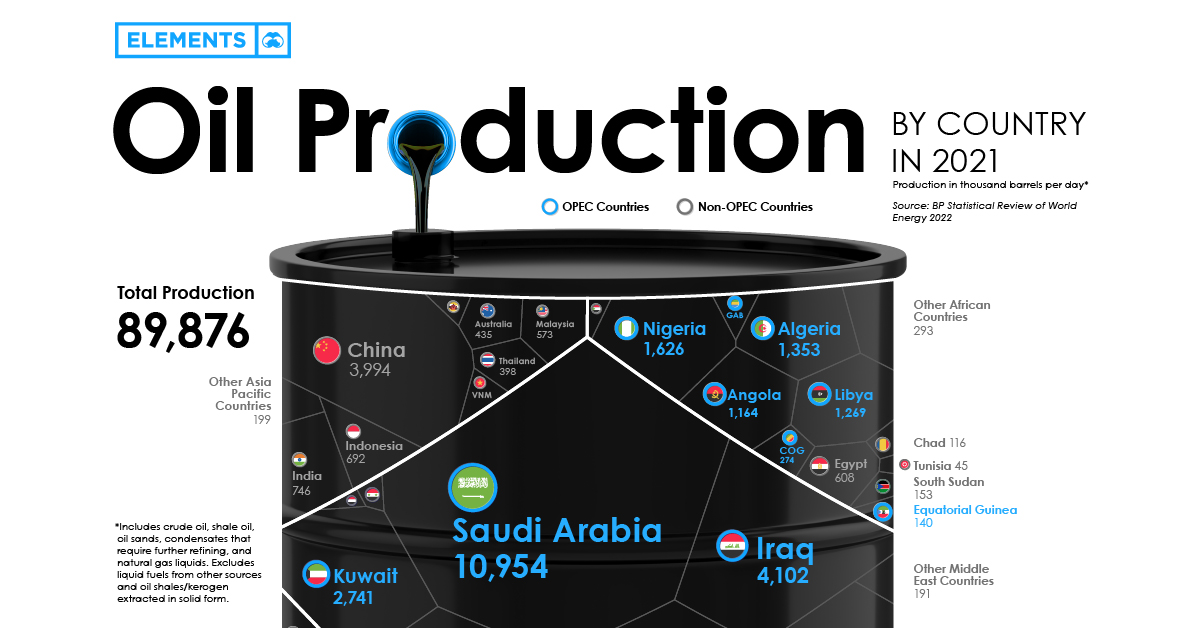
Using data from BP’s Statistical Review of World Energy, the above infographic provides further context on the crisis by visualizing the world’s largest oil producers in 2021.
Oil Production: OPEC Countries vs. Rest of the World
Before looking at country-level data, it’s worth seeing the amount of oil the Organization of Petroleum Exporting Countries (OPEC) produces compared to other organizations and regions.
| Region/Organization | 2021 Oil Production (barrels per day) | % of Total |
|---|---|---|
| OPEC | 31.7M | 35% |
| North America | 23.9M | 27% |
| Commonwealth of Independent States (CIS) | 13.8M | 15% |
| Rest of the World | 20.5M | 23% |
| Total | 89.9M | 100% |
The OPEC countries are the largest oil producers collectively, with Saudi Arabia alone making up one-third of OPEC production. It’s also important to note that OPEC production remains below pre-pandemic levels after the organization reduced its output by an unprecedented 10 million barrels per day (B/D) in 2020.
Following the OPEC countries, the U.S., Canada, and Mexico accounted for just over a quarter of global oil production in 2021. Nearly 70% of North American oil production came from the U.S., the world’s largest oil producer.
Similarly, within the CIS—an organization of post-Soviet Union countries—Russia was by far the largest producer, accounting for 80% of total CIS production.
The Largest Oil Producers in 2021
Roughly 43% of the world’s oil production came from just three countries in 2021—the U.S., Saudi Arabia, and Russia. Together, these three countries produced more oil than the rest of the top 10 combined.
| Country | 2021 Oil Production (barrels per day) | % of Total |
|---|---|---|
| U.S. 🇺🇸 | 16.6M | 18.5% |
| Saudi Arabia 🇸🇦 | 11M | 12.2% |
| Russian Federation 🇷🇺 | 10.9M | 12.2% |
| Canada 🇨🇦 | 5.4M | 6.0% |
| Iraq 🇮🇶 | 4.1M | 4.6% |
| China 🇨🇳 | 4.0M | 4.4% |
| United Arab Emirates 🇦🇪 | 3.7M | 4.1% |
| Iran 🇮🇷 | 3.6M | 4.0% |
| Brazil 🇧🇷 | 3.0M | 3.3% |
| Kuwait 🇰🇼 | 2.7M | 3.0% |
| Norway 🇳🇴 | 2.0M | 2.3% |
| Mexico 🇲🇽 | 1.9M | 2.1% |
| Kazakhstan 🇰🇿 | 1.8M | 2.0% |
| Qatar 🇶🇦 | 1.7M | 1.9% |
| Nigeria 🇳🇬 | 1.6M | 1.8% |
| Algeria 🇩🇿 | 1.4M | 1.5% |
| Libya 🇱🇾 | 1.3M | 1.4% |
| Angola 🇦🇴 | 1.2M | 1.3% |
| Oman 🇴🇲 | 0.97M | 1.1% |
| United Kingdom 🇬🇧 | 0.87M | 1.0% |
| India 🇮🇳 | 0.75M | 0.8% |
| Colombia 🇨🇴 | 0.74M | 0.8% |
| Azerbaijan 🇦🇿 | 0.72M | 0.8% |
| Indonesia 🇮🇩 | 0.69M | 0.8% |
| Venezuela 🇻🇪 | 0.65M | 0.7% |
| Argentina 🇦🇷 | 0.63M | 0.7% |
| Egypt 🇪🇬 | 0.60M | 0.7% |
| Malaysia 🇲🇾 | 0.57M | 0.6% |
| Ecuador 🇪🇨 | 0.47M | 0.5% |
| Australia 🇦🇺 | 0.44M | 0.5% |
| Thailand 🇹🇭 | 0.39M | 0.4% |
| Republic of Congo 🇨🇬 | 0.27M | 0.3% |
| Turkmenistan 🇹🇲 | 0.25M | 0.3% |
| Vietnam 🇻🇳 | 0.19M | 0.2% |
| Gabon 🇬🇦 | 0.18M | 0.2% |
| South Sudan 🇸🇩 | 0.15M | 0.2% |
| Equatorial Guinea 🇬🇳 | 0.14M | 0.2% |
| Peru 🇵🇪 | 0.13M | 0.1% |
| Chad 🇹🇩 | 0.12M | 0.1% |
| Brunei 🇧🇳 | 0.10M | 0.1% |
| Italy 🇮🇹 | 0.10M | 0.1% |
| Syria 🇸🇾 | 0.10M | 0.1% |
| Trinidad & Tobago 🇹🇹 | 0.08M | 0.1% |
| Romania 🇷🇴 | 0.07M | 0.1% |
| Yemen 🇾🇪 | 0.07M | 0.1% |
| Denmark 🇩🇰 | 0.07M | 0.1% |
| Sudan 🇸🇩 | 0.06M | 0.1% |
| Uzbekistan 🇺🇿 | 0.06M | 0.1% |
| Tunisia 🇹🇳 | 0.05M | 0.1% |
| Rest of the World 🌍 | 1.2M | 1.4% |
| Total | 89.9M | 100.0% |
Over the last few decades, U.S. oil production has been on a rollercoaster of troughs and peaks. After falling from its 1970 peak of 11.3 million B/D, it reached a historic low of 6.8 million B/D in 2008. However, following a turnaround in the 2010s, the country has since surpassed Saudi Arabia as the largest oil producer. As of 2021, though, the U.S. remained a net importer of crude oil while exporting refined petroleum products.
Saudi Arabia and Russia each produced roughly 11 million B/D in 2021 and were the two largest oil exporters globally. In both countries, state-owned oil firms (Saudi Aramco and Gazprom, respectively) were the most valuable oil and gas producing companies.
From Europe (excluding Russia), only Norway made the top 15 oil producers, accounting for 2.3% of global production. The lack of regional output partly explains the European Union’s dependence on Russian oil and gas, worsening the region’s energy crisis.
How the Energy Crisis is Affecting Oil Production
After a deep dive in 2020, oil demand is resurfacing and is now above pre-pandemic levels. Furthermore, supply constraints due to sanctions on Russian oil and gas tighten the market and support high oil prices.
While the impact has been felt globally, European countries have been hit hard due to their reliance on Russia’s fossil fuel exports, with some getting almost all of their energy fuels from Russia.
To combat the oil crunch, the rest of the world is ramping up oil supply through increased production or releasing strategic petroleum reserves (SPRs). U.S. oil production is expected to rise by 1 million B/D in 2022 to a record-high. Simultaneously, Western nations are calling on OPEC members to increase their output to ease prices. However, OPEC nations are sticking to their planned production hikes, with output still below early 2020 levels.
“We had a good discussion on ensuring global energy security and adequate oil supplies to support global economic growth. And that will begin shortly.”– U.S. President Joe Biden on his recent visit to Saudi Arabia
The U.S. is releasing 180 million barrels of oil from its SPR, of which 60 million barrels will contribute to the IEA’s collective release of 120 million barrels. But with oil demand expected to reach a new all-time high in 2023, it remains to be seen whether these efforts to increase supply will be enough to curb the crunch.


Energy
Charted: 4 Reasons Why Lithium Could Be the Next Gold Rush
Visual Capitalist has partnered with EnergyX to show why drops in prices and growing demand may make now the right time to invest in lithium.


4 Reasons Why You Should Invest in Lithium
Lithium’s importance in powering EVs makes it a linchpin of the clean energy transition and one of the world’s most precious minerals.
In this graphic, Visual Capitalist partnered with EnergyX to explore why now may be the time to invest in lithium.
1. Lithium Prices Have Dropped
One of the most critical aspects of evaluating an investment is ensuring that the asset’s value is higher than its price would indicate. Lithium is integral to powering EVs, and, prices have fallen fast over the last year:
| Date | LiOH·H₂O* | Li₂CO₃** |
|---|---|---|
| Feb 2023 | $76 | $71 |
| March 2023 | $71 | $61 |
| Apr 2023 | $43 | $33 |
| May 2023 | $43 | $33 |
| June 2023 | $47 | $45 |
| July 2023 | $44 | $40 |
| Aug 2023 | $35 | $35 |
| Sept 2023 | $28 | $27 |
| Oct 2023 | $24 | $23 |
| Nov 2023 | $21 | $21 |
| Dec 2023 | $17 | $16 |
| Jan 2024 | $14 | $15 |
| Feb 2024 | $13 | $14 |
Note: Monthly spot prices were taken as close to the 14th of each month as possible.
*Lithium hydroxide monohydrate MB-LI-0033
**Lithium carbonate MB-LI-0029
2. Lithium-Ion Battery Prices Are Also Falling
The drop in lithium prices is just one reason to invest in the metal. Increasing economies of scale, coupled with low commodity prices, have caused the cost of lithium-ion batteries to drop significantly as well.
In fact, BNEF reports that between 2013 and 2023, the price of a Li-ion battery dropped by 82%.
| Year | Price per KWh |
|---|---|
| 2023 | $139 |
| 2022 | $161 |
| 2021 | $150 |
| 2020 | $160 |
| 2019 | $183 |
| 2018 | $211 |
| 2017 | $258 |
| 2016 | $345 |
| 2015 | $448 |
| 2014 | $692 |
| 2013 | $780 |

3. EV Adoption is Sustainable
One of the best reasons to invest in lithium is that EVs, one of the main drivers behind the demand for lithium, have reached a price point similar to that of traditional vehicle.
According to the Kelly Blue Book, Tesla’s average transaction price dropped by 25% between 2022 and 2023, bringing it in line with many other major manufacturers and showing that EVs are a realistic transport option from a consumer price perspective.
| Manufacturer | September 2022 | September 2023 |
|---|---|---|
| BMW | $69,000 | $72,000 |
| Ford | $54,000 | $56,000 |
| Volkswagon | $54,000 | $56,000 |
| General Motors | $52,000 | $53,000 |
| Tesla | $68,000 | $51,000 |
4. Electricity Demand in Transport is Growing
As EVs become an accessible transport option, there’s an investment opportunity in lithium. But possibly the best reason to invest in lithium is that the IEA reports global demand for the electricity in transport could grow dramatically by 2030:
| Transport Type | 2022 | 2025 | 2030 |
|---|---|---|---|
| Buses 🚌 | 23,000 GWh | 50,000 GWh | 130,000 GWh |
| Cars 🚙 | 65,000 GWh | 200,000 GWh | 570,000 GWh |
| Trucks 🛻 | 4,000 GWh | 15,000 GWh | 94,000 GWh |
| Vans 🚐 | 6,000 GWh | 16,000 GWh | 72,000 GWh |
The Lithium Investment Opportunity
Lithium presents a potentially classic investment opportunity. Lithium and battery prices have dropped significantly, and recently, EVs have reached a price point similar to other vehicles. By 2030, the demand for clean energy, especially in transport, will grow dramatically.
With prices dropping and demand skyrocketing, now is the time to invest in lithium.
EnergyX is poised to exploit lithium demand with cutting-edge lithium extraction technology capable of extracting 300% more lithium than current processes.

-

 Lithium2 days ago
Ranked: The Top 10 EV Battery Manufacturers in 2023
Asia dominates this ranking of the world’s largest EV battery manufacturers in 2023.
-

 Energy1 week ago
The World’s Biggest Nuclear Energy Producers
China has grown its nuclear capacity over the last decade, now ranking second on the list of top nuclear energy producers.
-

 Energy4 weeks ago
The World’s Biggest Oil Producers in 2023
Just three countries accounted for 40% of global oil production last year.
-

 Energy1 month ago
How Much Does the U.S. Depend on Russian Uranium?
Currently, Russia is the largest foreign supplier of nuclear power fuel to the U.S.
-

 Uranium2 months ago
Charted: Global Uranium Reserves, by Country
We visualize the distribution of the world’s uranium reserves by country, with 3 countries accounting for more than half of total reserves.
-

 Energy3 months ago
Visualizing the Rise of the U.S. as Top Crude Oil Producer
Over the last decade, the United States has established itself as the world’s top producer of crude oil, surpassing Saudi Arabia and Russia.

-

 Markets1 week ago
U.S. Debt Interest Payments Reach $1 Trillion
-

 Business2 weeks ago
Charted: Big Four Market Share by S&P 500 Audits
-

 Markets2 weeks ago
Ranked: The Most Valuable Housing Markets in America
-

 Money2 weeks ago
Which States Have the Highest Minimum Wage in America?
-

 AI2 weeks ago
Ranked: Semiconductor Companies by Industry Revenue Share
-

 Markets2 weeks ago
Ranked: The World’s Top Flight Routes, by Revenue
-

 Countries2 weeks ago
Population Projections: The World’s 6 Largest Countries in 2075
-

 Markets2 weeks ago
The Top 10 States by Real GDP Growth in 2023