Energy
Visualizing the World’s Largest Hydroelectric Dams
![]() Subscribe to the Elements free mailing list for more like this
Subscribe to the Elements free mailing list for more like this
Visualizing the World’s Largest Hydroelectric Dams
This was originally posted on Elements. Sign up to the free mailing list to get beautiful visualizations on natural resource megatrends in your email every week.
Did you know that hydroelectricity is the world’s biggest source of renewable energy? According to recent figures from the International Renewable Energy Agency (IRENA), it represents 40% of total capacity, ahead of solar (28%) and wind (27%).
This type of energy is generated by hydroelectric power stations, which are essentially large dams that use the water flow to spin a turbine. They can also serve secondary functions such as flow monitoring and flood control.
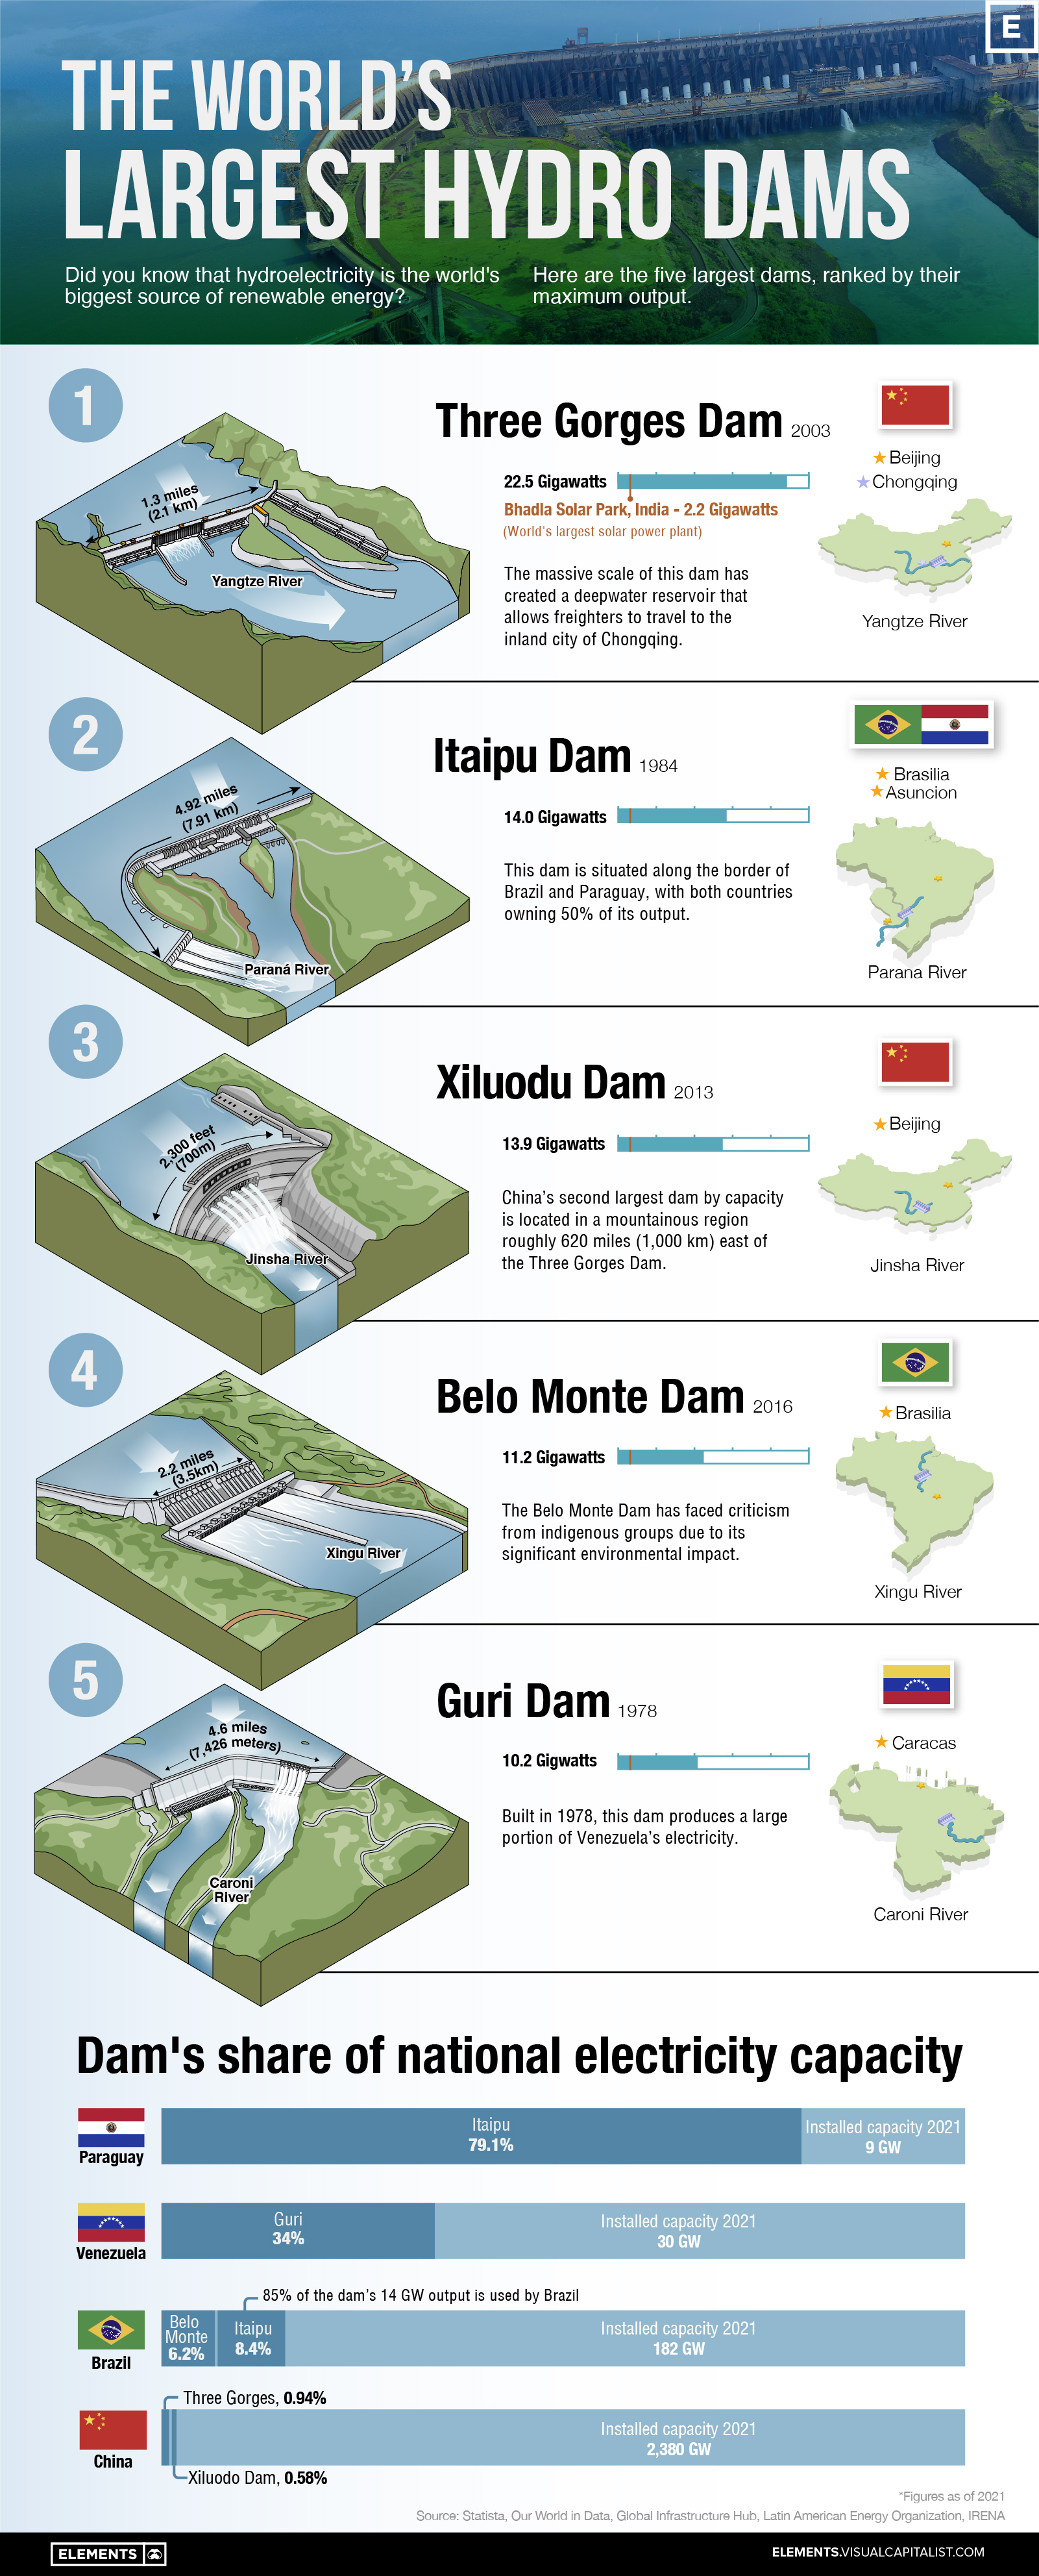
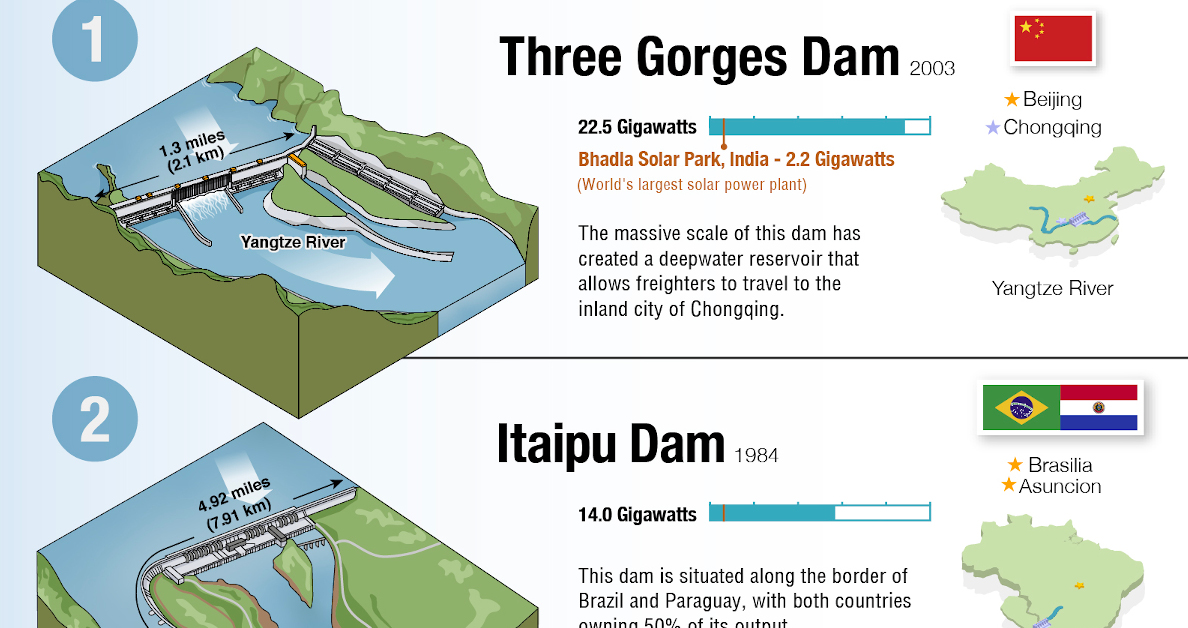
To help you learn more about hydropower, we’ve visualized the five largest hydroelectric dams in the world, ranked by their maximum output.
Overview of the Data
The following table lists key information about the five dams shown in this graphic, as of 2021. Installed capacity is the maximum amount of power that a plant can generate under full load.
| Country | Dam | River | Installed Capacity (gigawatts) | Dimensions (meters) |
|---|---|---|---|---|
| 🇨🇳 China | Three Gorges Dam | Yangtze River | 22.5 | 181 x 2,335 |
| 🇧🇷 Brazil / 🇵🇾 Paraguay | Itaipu Dam | Parana River | 14.0 | 196 x 7,919 |
| 🇨🇳 China | Xiluodu Dam | Jinsha River | 13.9 | 286 x 700 |
| 🇧🇷 Brazil | Belo Monte Dam | Xingu River | 11.2 | 90 X 3,545 |
| 🇻🇪 Venezuela | Guri Dam | Caroni River | 10.2 | 162 x 7,426 |
At the top of the list is China’s Three Gorges Dam, which opened in 2003. It has an installed capacity of 22.5 gigawatts (GW), which is close to double the second-place Itaipu Dam.
In terms of annual output, the Itaipu Dam actually produces about the same amount of electricity. This is because the Parana River has a low seasonal variance, meaning the flow rate changes very little throughout the year. On the other hand, the Yangtze River has a significant drop in flow for several months of the year.
For a point of comparison, here is the installed capacity of the world’s three largest solar power plants, also as of 2021:
- Bhadla Solar Park, India: 2.2 GW
- Hainan Solar Park, China: 2.2 GW
- Pavagada Solar Park, India: 2.1 GW
Compared to our largest dams, solar plants have a much lower installed capacity. However, in terms of cost (cents per kilowatt-hour), the two are actually quite even.
Closer Look: Three Gorges Dam
The Three Gorges Dam is an engineering marvel, costing over $32 billion to construct. To wrap your head around its massive scale, consider the following facts:
- The Three Gorges Reservoir (which feeds the dam) contains 39 trillion kg of water (42 billion tons)
- In terms of area, the reservoir spans 400 square miles (1,045 square km)
- The mass of this reservoir is large enough to slow the Earth’s rotation by 0.06 microseconds
Of course, any man-made structure this large is bound to have a profound impact on the environment. In a 2010 study, it was found that the dam has triggered over 3,000 earthquakes and landslides since 2003.
The Consequences of Hydroelectric Dams
While hydropower can be cost-effective, there are some legitimate concerns about its long-term sustainability.
For starters, hydroelectric dams require large upstream reservoirs to ensure a consistent supply of water. Flooding new areas of land can disrupt wildlife, degrade water quality, and even cause natural disasters like earthquakes.
Dams can also disrupt the natural flow of rivers. Other studies have found that millions of people living downstream from large dams suffer from food insecurity and flooding.
Whereas the benefits have generally been delivered to urban centers or industrial-scale agricultural developments, river-dependent populations located downstream of dams have experienced a difficult upheaval of their livelihoods.
– Richter, B.D. et al. (2010)
Perhaps the greatest risk to hydropower is climate change itself. For example, due to the rising frequency of droughts, hydroelectric dams in places like California are becoming significantly less economical.


Energy
The World’s Biggest Oil Producers in 2023
Just three countries accounted for 40% of global oil production last year.
The World’s Biggest Oil Producers in 2023
This was originally posted on Elements. Sign up to the free mailing list to get beautiful visualizations on natural resource megatrends in your email.
Despite efforts to decarbonize the global economy, oil still remains one of the world’s most important resources. It’s also produced by a fairly limited group of countries, which can be a source of economic and political leverage.
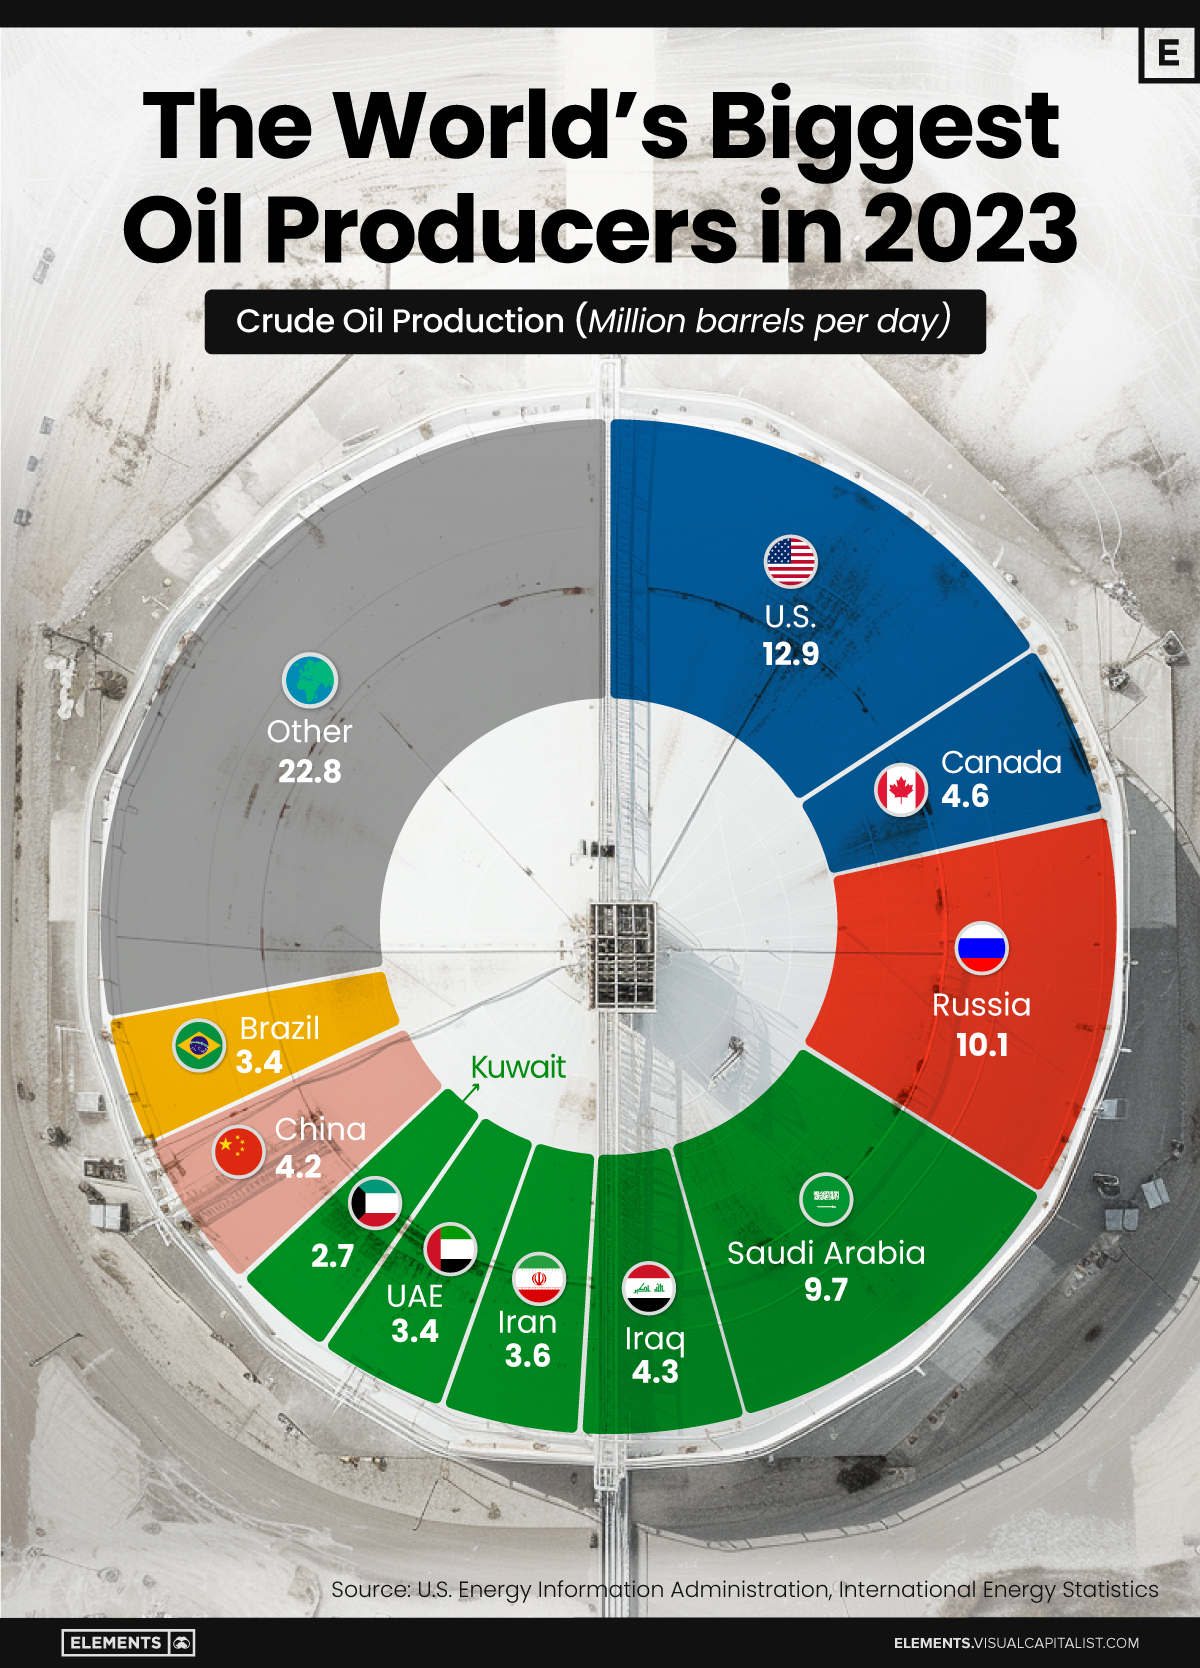
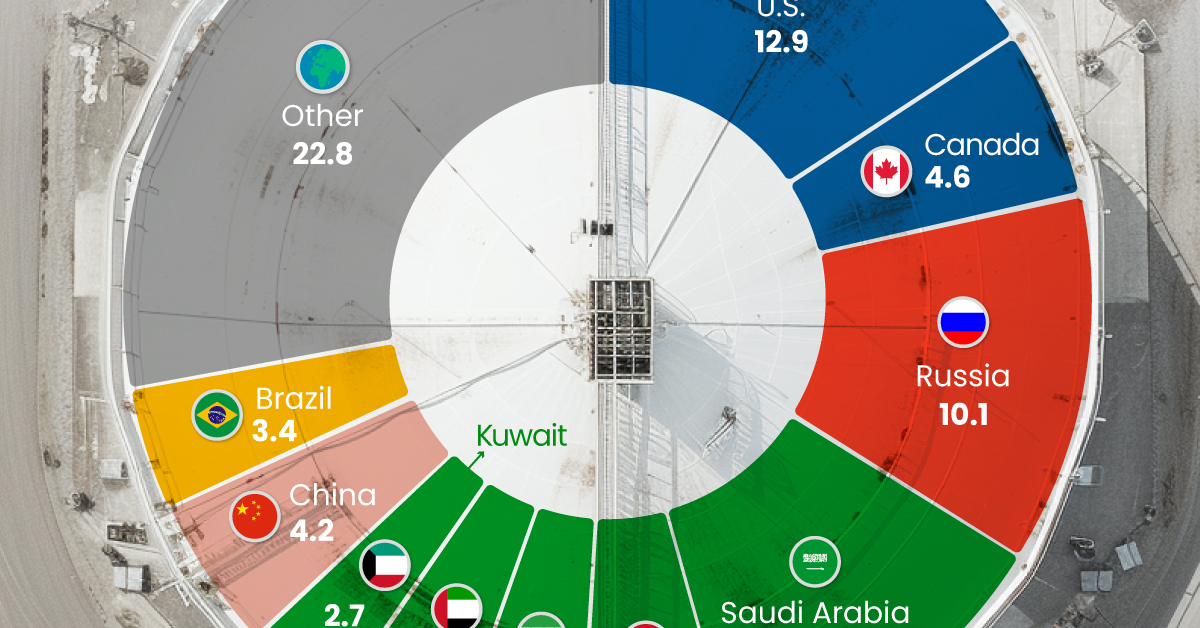
This graphic illustrates global crude oil production in 2023, measured in million barrels per day, sourced from the U.S. Energy Information Administration (EIA).
Three Countries Account for 40% of Global Oil Production
In 2023, the United States, Russia, and Saudi Arabia collectively contributed 32.7 million barrels per day to global oil production.
| Oil Production 2023 | Million barrels per day |
|---|---|
| 🇺🇸 U.S. | 12.9 |
| 🇷🇺 Russia | 10.1 |
| 🇸🇦 Saudi Arabia | 9.7 |
| 🇨🇦 Canada | 4.6 |
| 🇮🇶 Iraq | 4.3 |
| 🇨🇳 China | 4.2 |
| 🇮🇷 Iran | 3.6 |
| 🇧🇷 Brazil | 3.4 |
| 🇦🇪 UAE | 3.4 |
| 🇰🇼 Kuwait | 2.7 |
| 🌍 Other | 22.8 |
These three nations have consistently dominated oil production since 1971. The leading position, however, has alternated among them over the past five decades.
In contrast, the combined production of the next three largest producers—Canada, Iraq, and China—reached 13.1 million barrels per day in 2023, just surpassing the production of the United States alone.
In the near term, no country is likely to surpass the record production achieved by the U.S. in 2023, as no other producer has ever reached a daily capacity of 13.0 million barrels. Recently, Saudi Arabia’s state-owned Saudi Aramco scrapped plans to increase production capacity to 13.0 million barrels per day by 2027.
In 2024, analysts forecast that the U.S. will maintain its position as the top oil producer. In fact, according to Macquarie Group, U.S. oil production is expected to achieve a record pace of about 14 million barrels per day by the end of the year.

-

 Technology2 weeks ago
Ranked: The Most Popular Smartphone Brands in the U.S.
-

 Automotive1 week ago
Almost Every EV Stock is Down After Q1 2024
-

 Money1 week ago
Where Does One U.S. Tax Dollar Go?
-

 Green2 weeks ago
Ranked: Top Countries by Total Forest Loss Since 2001
-

 Real Estate2 weeks ago
Visualizing America’s Shortage of Affordable Homes
-

 Maps2 weeks ago
Mapped: Average Wages Across Europe
-

 Mining2 weeks ago
Charted: The Value Gap Between the Gold Price and Gold Miners
-

 Demographics2 weeks ago
Visualizing the Size of the Global Senior Population