Mining
Ranked: The World’s Largest Copper Producers
![]() Subscribe to the Elements free mailing list for more like this
Subscribe to the Elements free mailing list for more like this
Visualizing the World’s Largest Copper Producers
This was originally posted on Elements. Sign up to the free mailing list to get beautiful visualizations on natural resource megatrends in your email every week.
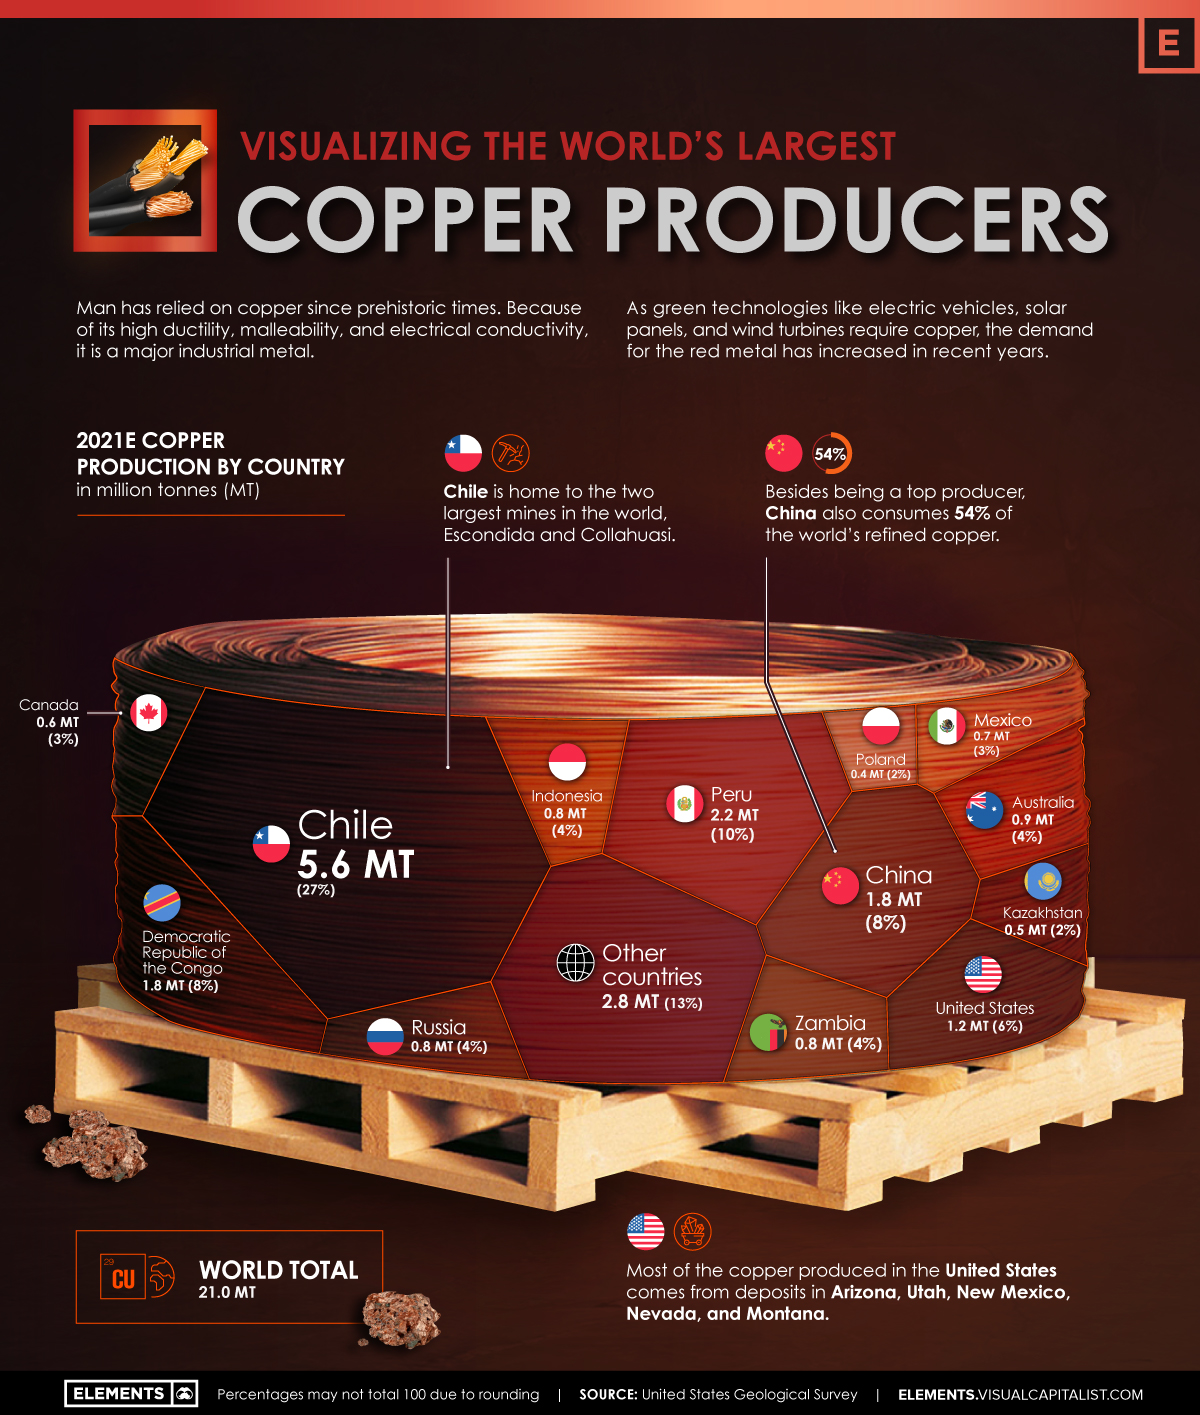
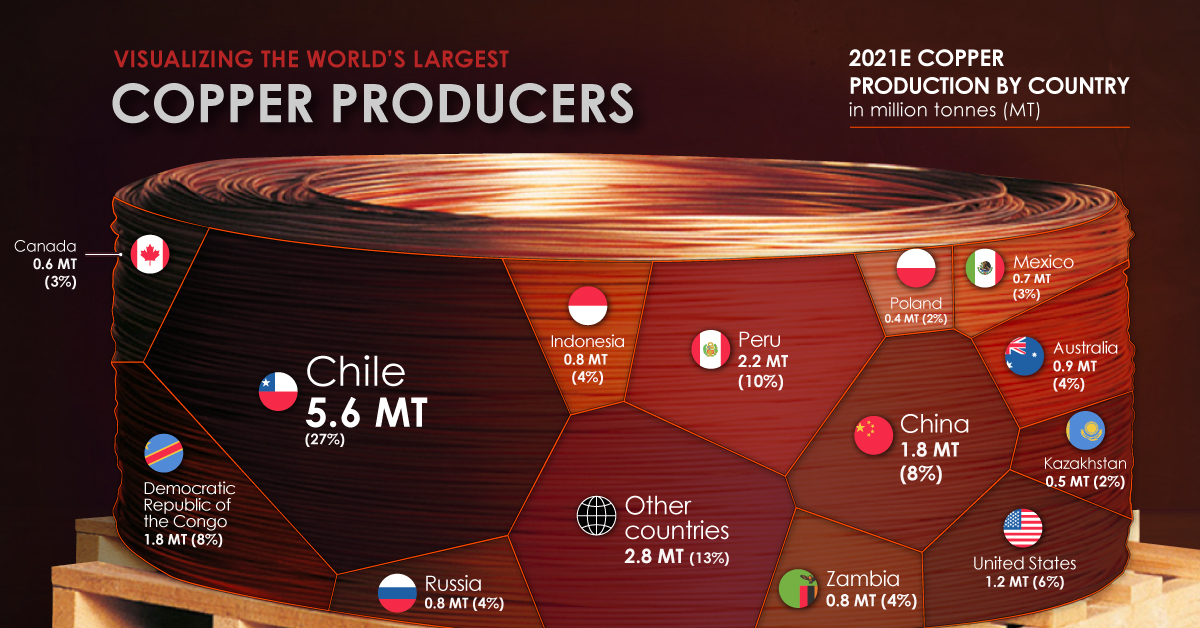
Man has relied on copper since prehistoric times. It is a major industrial metal with many applications due to its high ductility, malleability, and electrical conductivity.
Many new technologies critical to fighting climate change, like solar panels and wind turbines, rely on the red metal.
But where does the copper we use come from? Using the U.S. Geological Survey’s data, the above infographic lists the world’s largest copper producing countries in 2021.
The Countries Producing the World’s Copper
Many everyday products depend on minerals, including mobile phones, laptops, homes, and automobiles. Incredibly, every American requires 12 pounds of copper each year to maintain their standard of living.
North, South, and Central America dominate copper production, as these regions collectively host 15 of the 20 largest copper mines.
Chile is the top copper producer in the world, with 27% of global copper production. In addition, the country is home to the two largest mines in the world, Escondida and Collahuasi.
Chile is followed by another South American country, Peru, responsible for 10% of global production.
| Rank | Country | 2021E Copper Production (Million tonnes) | Share |
|---|---|---|---|
| #1 | 🇨🇱 Chile | 5.6 | 27% |
| #2 | 🇵🇪 Peru | 2.2 | 10% |
| #3 | 🇨🇳 China | 1.8 | 8% |
| #4 | 🇨🇩 DRC | 1.8 | 8% |
| #5 | 🇺🇸 United States | 1.2 | 6% |
| #6 | 🇦🇺 Australia | 0.9 | 4% |
| #7 | 🇷🇺 Russia | 0.8 | 4% |
| #8 | 🇿🇲 Zambia | 0.8 | 4% |
| #9 | 🇮🇩 Indonesia | 0.8 | 4% |
| #10 | 🇲🇽 Mexico | 0.7 | 3% |
| #11 | 🇨🇦 Canada | 0.6 | 3% |
| #12 | 🇰🇿 Kazakhstan | 0.5 | 2% |
| #13 | 🇵🇱 Poland | 0.4 | 2% |
| 🌍 Other countries | 2.8 | 13% | |
| 🌐 World total | 21.0 | 100% |
The Democratic Republic of Congo (DRC) and China share third place, with 8% of global production each. Along with being a top producer, China also consumes 54% of the world’s refined copper.
Copper’s Role in the Green Economy
Technologies critical to the energy transition, such as EVs, batteries, solar panels, and wind turbines require much more copper than conventional fossil fuel based counterparts.
For example, copper usage in EVs is up to four times more than in conventional cars. According to the Copper Alliance, renewable energy systems can require up to 12x more copper compared to traditional energy systems.
| Technology | 2020 Installed Capacity (megawatts) | Copper Content (2020, tonnes) | 2050p Installed Capacity (megawatts) | Copper Content (2050p, tonnes) |
|---|---|---|---|---|
| Solar PV | 126,735 MW | 633,675 | 372,000 MW | 1,860,000 |
| Onshore Wind | 105,015 MW | 451,565 | 202,000 MW | 868,600 |
| Offshore Wind | 6,013 MW | 57,725 | 45,000 MW | 432,000 |
With these technologies’ rapid and large-scale deployment, copper demand from the energy transition is expected to increase by nearly 600% by 2030.
As the transition to renewable energy and electrification speeds up, so will the pressure for more copper mines to come online.


Lithium
Ranked: The Top 10 EV Battery Manufacturers in 2023
Asia dominates this ranking of the world’s largest EV battery manufacturers in 2023.


The Top 10 EV Battery Manufacturers in 2023
This was originally posted on our Voronoi app. Download the app for free on iOS or Android and discover incredible data-driven charts from a variety of trusted sources.
Despite efforts from the U.S. and EU to secure local domestic supply, all major EV battery manufacturers remain based in Asia.
In this graphic we rank the top 10 EV battery manufacturers by total battery deployment (measured in megawatt-hours) in 2023. The data is from EV Volumes.
Chinese Dominance
Contemporary Amperex Technology Co. Limited (CATL) has swiftly risen in less than a decade to claim the title of the largest global battery group.
The Chinese company now has a 34% share of the market and supplies batteries to a range of made-in-China vehicles, including the Tesla Model Y, SAIC’s MG4/Mulan, and various Li Auto models.
| Company | Country | 2023 Production (megawatt-hour) | Share of Total Production |
|---|---|---|---|
| CATL | 🇨🇳 China | 242,700 | 34% |
| BYD | 🇨🇳 China | 115,917 | 16% |
| LG Energy Solution | 🇰🇷 Korea | 108,487 | 15% |
| Panasonic | 🇯🇵 Japan | 56,560 | 8% |
| SK On | 🇰🇷 Korea | 40,711 | 6% |
| Samsung SDI | 🇰🇷 Korea | 35,703 | 5% |
| CALB | 🇨🇳 China | 23,493 | 3% |
| Farasis Energy | 🇨🇳 China | 16,527 | 2% |
| Envision AESC | 🇨🇳 China | 8,342 | 1% |
| Sunwoda | 🇨🇳 China | 6,979 | 1% |
| Other | - | 56,040 | 8% |
In 2023, BYD surpassed LG Energy Solution to claim second place. This was driven by demand from its own models and growth in third-party deals, including providing batteries for the made-in-Germany Tesla Model Y, Toyota bZ3, Changan UNI-V, Venucia V-Online, as well as several Haval and FAW models.
The top three battery makers (CATL, BYD, LG) collectively account for two-thirds (66%) of total battery deployment.
Once a leader in the EV battery business, Panasonic now holds the fourth position with an 8% market share, down from 9% last year. With its main client, Tesla, now sourcing batteries from multiple suppliers, the Japanese battery maker seems to be losing its competitive edge in the industry.
Overall, the global EV battery market size is projected to grow from $49 billion in 2022 to $98 billion by 2029, according to Fortune Business Insights.

-

 Markets1 week ago
U.S. Debt Interest Payments Reach $1 Trillion
-

 Business2 weeks ago
Charted: Big Four Market Share by S&P 500 Audits
-

 Real Estate2 weeks ago
Ranked: The Most Valuable Housing Markets in America
-

 Money2 weeks ago
Which States Have the Highest Minimum Wage in America?
-

 AI2 weeks ago
Ranked: Semiconductor Companies by Industry Revenue Share
-

 Markets2 weeks ago
Ranked: The World’s Top Flight Routes, by Revenue
-

 Demographics2 weeks ago
Population Projections: The World’s 6 Largest Countries in 2075
-

 Markets2 weeks ago
The Top 10 States by Real GDP Growth in 2023