Technology
Visualizing the State of 5G Networks Worldwide
View the full-size version of this infographic.
Visualizing the State of 5G Networks Worldwide
View the high resolution of this infographic by clicking here.
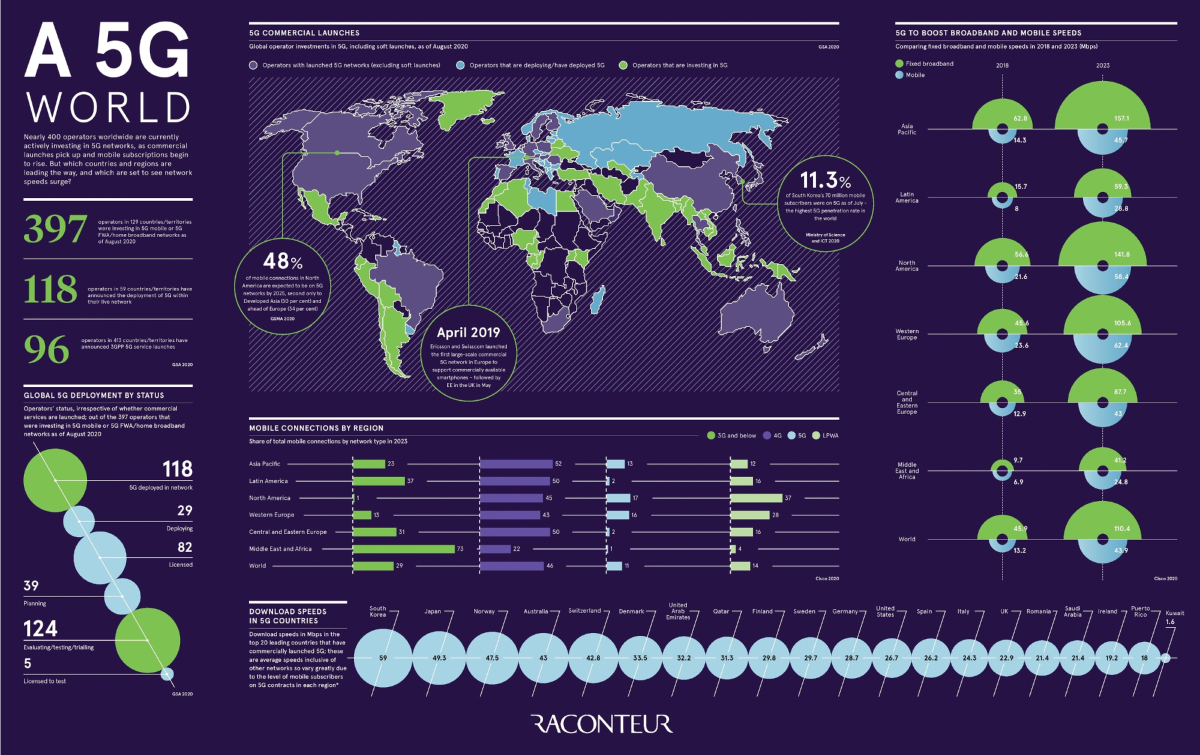
By 2025, the world will reach 1.8 billion 5G connections—led by Developed Asia and North America, two regions that could each see nearly half of mobile connections operating on 5G networks.
This sweeping rollout relies on infrastructure capacities, and many operators are buying in big to usher in 5G adoption. This infographic from Raconteur covers where we are on the roadmap towards 5G becoming mainstream, and which regions are leading the way in connectivity.
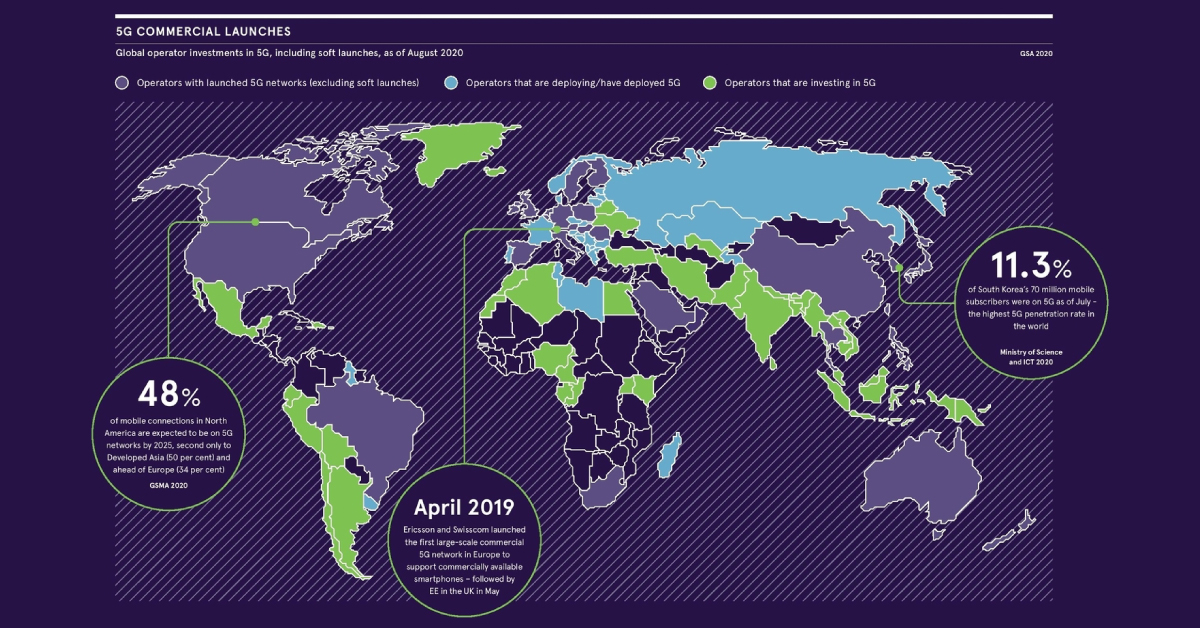
Commercial Launches of 5G Networks
From its earliest iterations to the Internet of Things, we’ve surpassed three generations of wireless networks. Now, 5G is at a tipping point.
5G is unique in that in order to actually start using the network, you need a device that works on it—unlike previous generations where they could simply switch over. Moreover, carriers need to invest in the infrastructure to optimize network access and the density of devices using it.
As more operators buy into the technology, the latter is finally beginning to happen in some areas. Here’s how the total numbers break down across the world, as of mid-September 2020:
- 397 operators are investing in 5G mobile or 5G fixed wireless access/home broadband networks
- 118 operators have announced the deployment of 5G within their live network
- 96 operators have announced 3GPP (protocols for mobile telecomms) 5G service launches
Major phone operators and even tech companies are behind accelerating this change, from Vodafone to Verizon—and most recently, Microsoft has entered the playing field.
Cross-Generational Mobile Connections, By Region
As Cisco highlights, there’s more room to grow yet. By 2023, North America will have the highest share of 5G networks, at 17% within the region.
| Region | ≤ 3G | 4G | 5G | LPWA |
|---|---|---|---|---|
| Asia Pacific | 23% | 52% | 13% | 12% |
| Latin America | 37% | 50% | 2% | 16% |
| North America | 1% | 45% | 17% | 37% |
| Western Europe | 13% | 43% | 16% | 28% |
| Central & Eastern Europe | 31% | 50% | 2% | 16% |
| Middle East & Africa | 73% | 22% | 1% | 4% |
| World | 29% | 46% | 11% | 14% |
*Low-power wide-area (LPWA) networks are a generic type of network that can coexist across 2G, 3G, and 4G. Network shares may not add up due to rounding.
Meanwhile, the Middle East and Africa could have the most catching up to do, with 73% of the region still operating on 3G networks or less in 2023. The good news? Commercial 5G trials in Nigeria may signal the potential of networks leapfrogging ahead.
Need for Speed
As the number of 5G networks tick up, there will be an undeniable boost to mobile and broadband speeds (Mbps) across regions by 2023. In particular, Asia Pacific will have the fastest broadband speeds at 157 Mbps while Western Europe will lead with 62 Mbps on mobile.
| Region | Mobile (2018) | Mobile (2023) | Broadband (2018) | Broadband (2023) |
|---|---|---|---|---|
| Asia Pacific | 14.3 | 45.7 | 62.8 | 157.1 |
| Latin America | 8.0 | 28.8 | 15.7 | 59.3 |
| North America | 21.6 | 58.4 | 56.6 | 141.8 |
| Western Europe | 23.6 | 62.4 | 45.6 | 123.0 |
| Central & Eastern Europe | 12.9 | 43.0 | 35.0 | 87.7 |
| Middle East & Africa | 6.9 | 24.8 | 9.7 | 41.2 |
| World | 13.2 | 43.9 | 45.9 | 110.4 |
Faster speeds is one of several factors catapulting the promise of 5G networks to unlock transformations across entire industries, from manufacturing to healthcare.
What further advancements could dial reach region’s share of 5G networks all the way up?


Technology
Visualizing AI Patents by Country
See which countries have been granted the most AI patents each year, from 2012 to 2022.


Visualizing AI Patents by Country
This was originally posted on our Voronoi app. Download the app for free on iOS or Android and discover incredible data-driven charts from a variety of trusted sources.
This infographic shows the number of AI-related patents granted each year from 2010 to 2022 (latest data available). These figures come from the Center for Security and Emerging Technology (CSET), accessed via Stanford University’s 2024 AI Index Report.
From this data, we can see that China first overtook the U.S. in 2013. Since then, the country has seen enormous growth in the number of AI patents granted each year.
| Year | China | EU and UK | U.S. | RoW | Global Total |
|---|---|---|---|---|---|
| 2010 | 307 | 137 | 984 | 571 | 1,999 |
| 2011 | 516 | 129 | 980 | 581 | 2,206 |
| 2012 | 926 | 112 | 950 | 660 | 2,648 |
| 2013 | 1,035 | 91 | 970 | 627 | 2,723 |
| 2014 | 1,278 | 97 | 1,078 | 667 | 3,120 |
| 2015 | 1,721 | 110 | 1,135 | 539 | 3,505 |
| 2016 | 1,621 | 128 | 1,298 | 714 | 3,761 |
| 2017 | 2,428 | 144 | 1,489 | 1,075 | 5,136 |
| 2018 | 4,741 | 155 | 1,674 | 1,574 | 8,144 |
| 2019 | 9,530 | 322 | 3,211 | 2,720 | 15,783 |
| 2020 | 13,071 | 406 | 5,441 | 4,455 | 23,373 |
| 2021 | 21,907 | 623 | 8,219 | 7,519 | 38,268 |
| 2022 | 35,315 | 1,173 | 12,077 | 13,699 | 62,264 |
In 2022, China was granted more patents than every other country combined.
While this suggests that the country is very active in researching the field of artificial intelligence, it doesn’t necessarily mean that China is the farthest in terms of capability.
Key Facts About AI Patents
According to CSET, AI patents relate to mathematical relationships and algorithms, which are considered abstract ideas under patent law. They can also have different meaning, depending on where they are filed.
In the U.S., AI patenting is concentrated amongst large companies including IBM, Microsoft, and Google. On the other hand, AI patenting in China is more distributed across government organizations, universities, and tech firms (e.g. Tencent).
In terms of focus area, China’s patents are typically related to computer vision, a field of AI that enables computers and systems to interpret visual data and inputs. Meanwhile America’s efforts are more evenly distributed across research fields.
Learn More About AI From Visual Capitalist
If you want to see more data visualizations on artificial intelligence, check out this graphic that shows which job departments will be impacted by AI the most.

-

 Mining1 week ago
Gold vs. S&P 500: Which Has Grown More Over Five Years?
-

 Markets2 weeks ago
Ranked: The Most Valuable Housing Markets in America
-

 Money2 weeks ago
Which States Have the Highest Minimum Wage in America?
-

 AI2 weeks ago
Ranked: Semiconductor Companies by Industry Revenue Share
-

 Markets2 weeks ago
Ranked: The World’s Top Flight Routes, by Revenue
-

 Countries2 weeks ago
Population Projections: The World’s 6 Largest Countries in 2075
-

 Markets2 weeks ago
The Top 10 States by Real GDP Growth in 2023
-

 Demographics2 weeks ago
The Smallest Gender Wage Gaps in OECD Countries