Technology
Visualizing the Social Media Universe in 2020


Visualizing the Social Media Universe in 2020
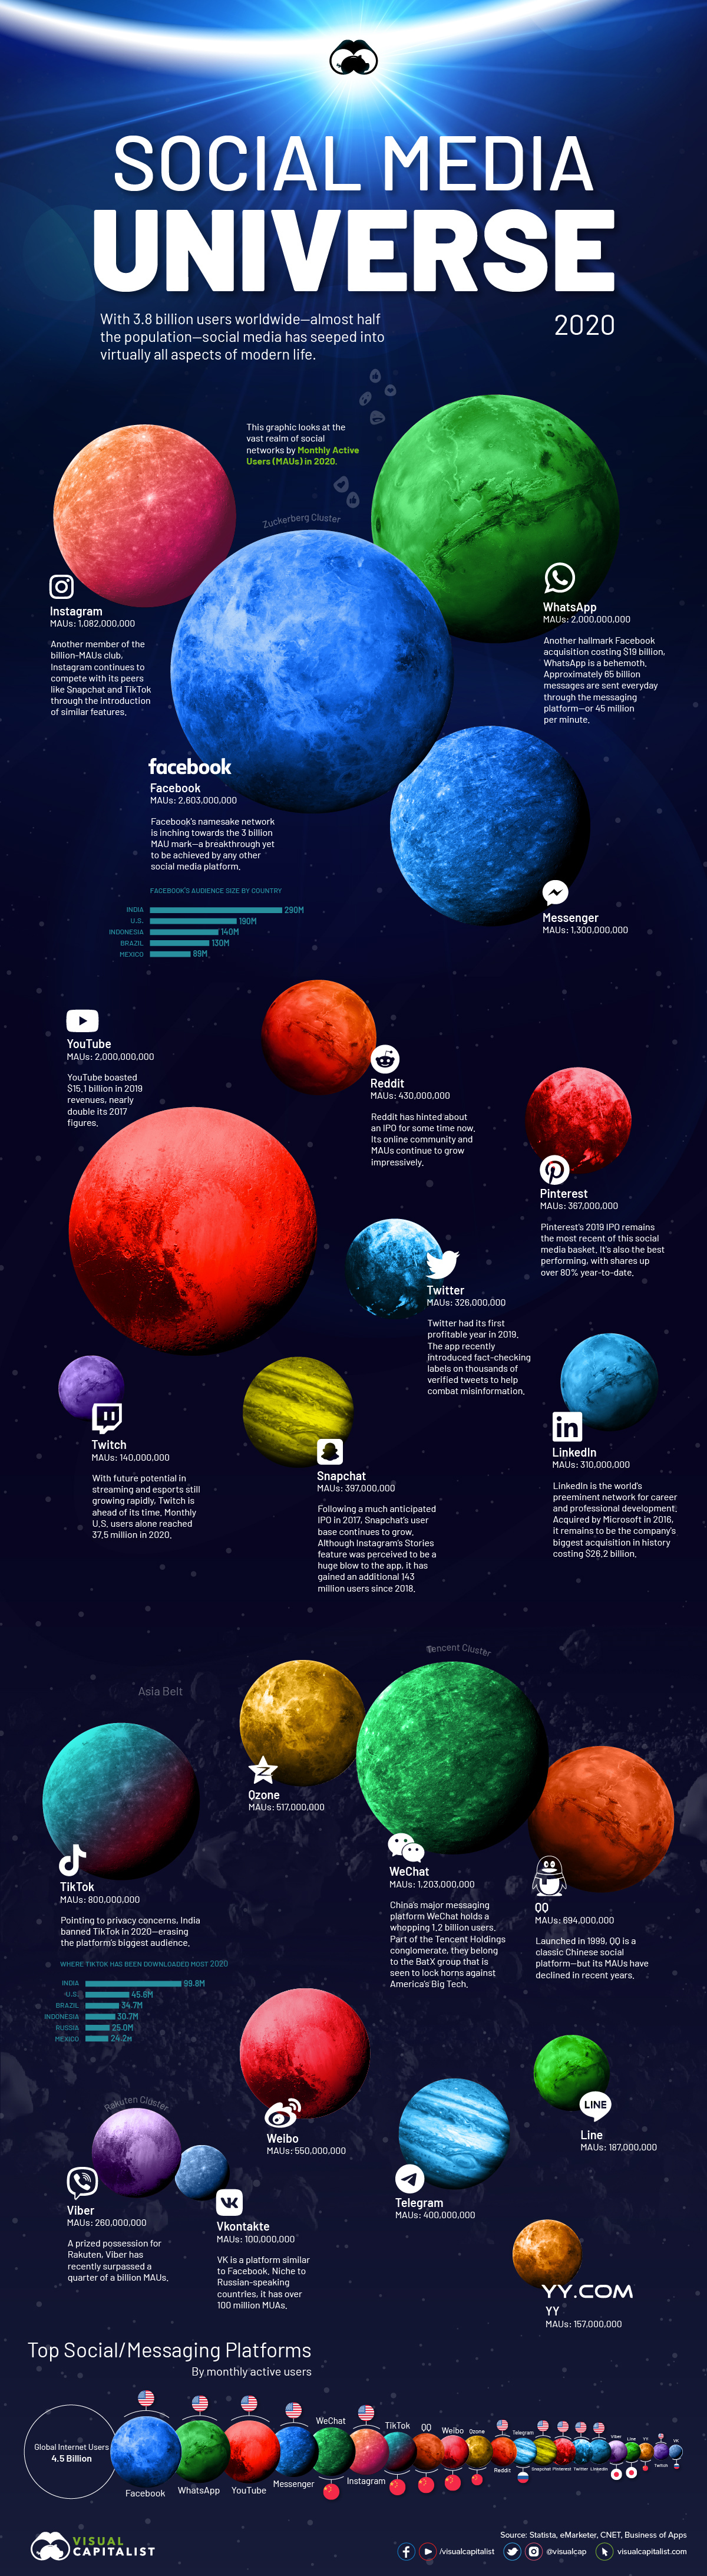
Social media has seeped into virtually all aspects of modern life. The vast social media universe collectively now holds 3.8 billion users, representing roughly 50% of the global population.
With an additional billion internet users projected to come online in the coming years, it’s possible that the social media universe could expand even further.
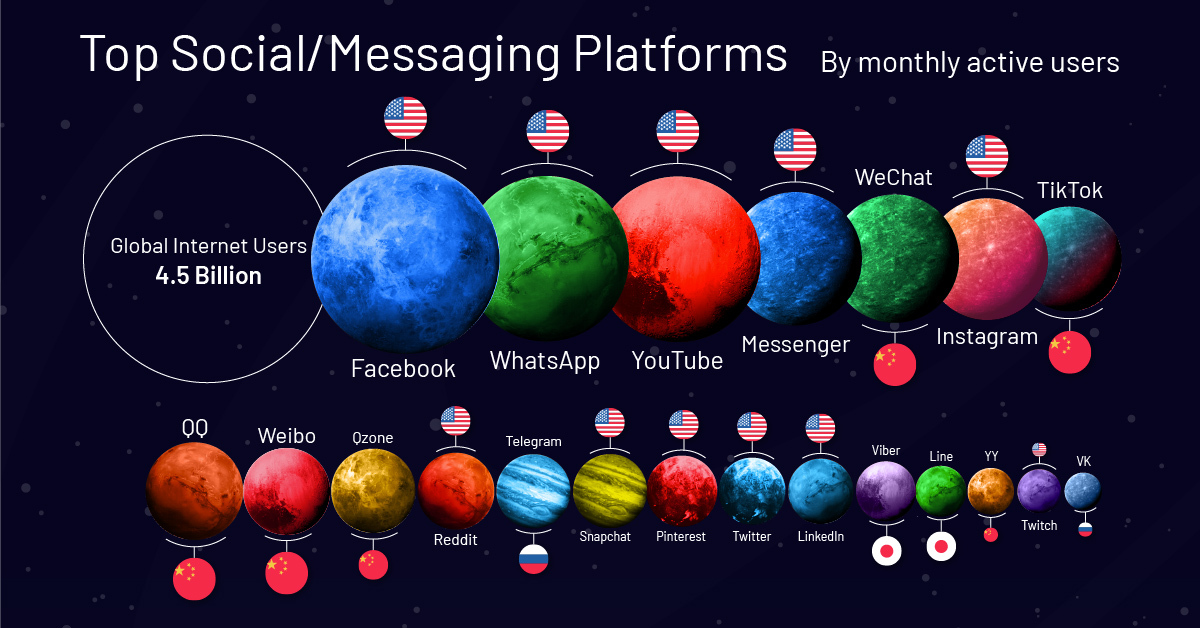
How the Networks Stack Up
To begin, let’s take a look at how social networks compare in terms of monthly active users (MAUs)—an industry metric widely used to gauge the success of these platforms.
| Rank | Social Network | MAUs In Millions | Country of Origin |
|---|---|---|---|
| #1 | 2,603 | 🇺🇲 U.S. | |
| #2 | 2,000 | 🇺🇲 U.S. | |
| #3 | YouTube | 2,000 | 🇺🇲 U.S. |
| #4 | Messenger | 1,300 | 🇺🇲 U.S. |
| #5 | 1,203 | 🇨🇳 China | |
| #6 | 1,082 | 🇺🇲 U.S. | |
| #7 | TikTok | 800 | 🇨🇳 China |
| #8 | 694 | 🇨🇳 China | |
| #9 | 550 | 🇨🇳 China | |
| #10 | Qzone | 517 | 🇨🇳 China |
| #11 | 430 | 🇺🇲 U.S. | |
| #12 | Telegram | 400 | 🇷🇺 Russia |
| #13 | Snapchat | 397 | 🇺🇲 U.S. |
| #14 | 367 | 🇺🇲 U.S. | |
| #15 | 326 | 🇺🇲 U.S. | |
| #16 | 310 | 🇺🇲 U.S. | |
| #17 | Viber | 260 | 🇯🇵 Japan |
| #18 | Line | 187 | 🇯🇵 Japan |
| #19 | YY | 157 | 🇨🇳 China |
| #20 | Twitch | 140 | 🇺🇲 U.S. |
| #21 | Vkontakte | 100 | 🇷🇺 Russia |
Here’s a closer look at individual social platforms, and their trials and tribulations:
To put it mildly, Facebook has had its hands full. A flurry of companies are boycotting Facebook’s ads, while the platform struggles to fend off the spread of misinformation.
Yet, its stock price continues to advance to new highs while the traditional economy faces less than rosy forecasts. Facebook still possesses the largest cohort of users, inching closer to the 3 billion MAU mark—a breakthrough yet to be achieved by any company.
Snapchat
Snapchat and founder Evan Spiegel have had a bumpy road since their IPO in 2017. The stock price reached its nadir near $4 in 2018, reflecting investor concerns tied to the introduction of Instagram Stories. In recent times, the stock has advanced past the $20 mark, although there is still long-term unclarity around monetization and profitability.
YouTube
YouTube competes head on against traditional television and streaming programs for eyeballs. The platform raked in revenues of $15.1 billion in 2019, nearly double their figures in 2017.
Parent company Alphabet has invested in YouTube with new rollouts like YouTube Music (merged with what was once Google Music) and YouTube Premium—a bundled subscription-based platform providing music, ad-free content, and YouTube Originals. By the looks of it, the future of YouTube will be much more than just videos.
The biggest social platform in China, WeChat has flourished, now holding a whopping 1.2 billion MAUs. As part of the Tencent Holdings conglomerate, they belong to the BATX group that is seen to lock horns with America’s Big Tech.
There have been whispers of a Reddit IPO on Wall Street for some time now. While such an event has not yet materialized, Reddit’s success certainly has. With 430 million MAUs relative to 330 million in 2018, the company continues to attract a larger audience. The notion of community has taken on a different meaning in the digital age, and Reddit represents this transition with their ever-growing network of users.
Instagram has been vital to Facebook’s success, since its $1 billion acquisition in 2012. The platform attracts a younger audience compared to Facebook and it has demonstrated an ability to remain versatile, specifically by implementing Instagram Stories and Reels.
Busy schedules don’t seem to faze Jack Dorsey who has not one, but two CEO jobs in Twitter and Square. Twitter has been able to achieve profitability in the last two years, reporting net income figures of $1.2 and $1.5 billion in 2018 and 2019 respectively. They no doubt have their work cut out for them as they continue to combat fake news and similar controversies on their platform.
TikTok
If any publicity is good publicity, then 2020 has been TikTok’s year. Headlines include privacy breaches with alleged ties to the Chinese Communist Party, a banning of the app by India Prime Minister Narendra Modi, and now, talks of a partial U.S. acquisition. Potential acquirers include leaders Microsoft, Twitter, and Oracle.
Social Media Under Trial?
Despite the list of headwinds social media has faced, about half of the world is now on it—and there seems to be no end in sight for future growth.
How have companies with exposure to the social media universe fared in 2020 so far?
| Companies With Exposure To Social Media | YTD Price Returns |
|---|---|
| 83% | |
| Tencent Holdings | 43% |
| Snapchat | 32% |
| 30% | |
| 22% | |
| Alphabet | 17% |
Widespread participation in social media comes with its fair set of problems. Some companies such as Facebook have found themselves in the crosshairs on both sides of the political spectrum. As concerns grow around privacy and data, social media will be front and center in shaping the future of government, business, and politics.
Only time will tell just how high user counts will reach. The long-term trajectory suggests there’s more room left in the engine. There are still parts of the world that are just beginning to possess the technological infrastructure for social media to be a possibility. It’s plausible future growth will come from that avenue.
If stock prices of companies linked to social media are of relevance, their performance this year paired with the fact that they are trading near all-time highs supports such a growth thesis.


Technology
Visualizing AI Patents by Country
See which countries have been granted the most AI patents each year, from 2012 to 2022.


Visualizing AI Patents by Country
This was originally posted on our Voronoi app. Download the app for free on iOS or Android and discover incredible data-driven charts from a variety of trusted sources.
This infographic shows the number of AI-related patents granted each year from 2010 to 2022 (latest data available). These figures come from the Center for Security and Emerging Technology (CSET), accessed via Stanford University’s 2024 AI Index Report.
From this data, we can see that China first overtook the U.S. in 2013. Since then, the country has seen enormous growth in the number of AI patents granted each year.
| Year | China | EU and UK | U.S. | RoW | Global Total |
|---|---|---|---|---|---|
| 2010 | 307 | 137 | 984 | 571 | 1,999 |
| 2011 | 516 | 129 | 980 | 581 | 2,206 |
| 2012 | 926 | 112 | 950 | 660 | 2,648 |
| 2013 | 1,035 | 91 | 970 | 627 | 2,723 |
| 2014 | 1,278 | 97 | 1,078 | 667 | 3,120 |
| 2015 | 1,721 | 110 | 1,135 | 539 | 3,505 |
| 2016 | 1,621 | 128 | 1,298 | 714 | 3,761 |
| 2017 | 2,428 | 144 | 1,489 | 1,075 | 5,136 |
| 2018 | 4,741 | 155 | 1,674 | 1,574 | 8,144 |
| 2019 | 9,530 | 322 | 3,211 | 2,720 | 15,783 |
| 2020 | 13,071 | 406 | 5,441 | 4,455 | 23,373 |
| 2021 | 21,907 | 623 | 8,219 | 7,519 | 38,268 |
| 2022 | 35,315 | 1,173 | 12,077 | 13,699 | 62,264 |
In 2022, China was granted more patents than every other country combined.
While this suggests that the country is very active in researching the field of artificial intelligence, it doesn’t necessarily mean that China is the farthest in terms of capability.
Key Facts About AI Patents
According to CSET, AI patents relate to mathematical relationships and algorithms, which are considered abstract ideas under patent law. They can also have different meaning, depending on where they are filed.
In the U.S., AI patenting is concentrated amongst large companies including IBM, Microsoft, and Google. On the other hand, AI patenting in China is more distributed across government organizations, universities, and tech firms (e.g. Tencent).
In terms of focus area, China’s patents are typically related to computer vision, a field of AI that enables computers and systems to interpret visual data and inputs. Meanwhile America’s efforts are more evenly distributed across research fields.
Learn More About AI From Visual Capitalist
If you want to see more data visualizations on artificial intelligence, check out this graphic that shows which job departments will be impacted by AI the most.

-

 Markets1 week ago
U.S. Debt Interest Payments Reach $1 Trillion
-

 Markets2 weeks ago
Ranked: The Most Valuable Housing Markets in America
-

 Money2 weeks ago
Which States Have the Highest Minimum Wage in America?
-

 AI2 weeks ago
Ranked: Semiconductor Companies by Industry Revenue Share
-

 Markets2 weeks ago
Ranked: The World’s Top Flight Routes, by Revenue
-

 Countries2 weeks ago
Population Projections: The World’s 6 Largest Countries in 2075
-

 Markets2 weeks ago
The Top 10 States by Real GDP Growth in 2023
-

 Money2 weeks ago
The Smallest Gender Wage Gaps in OECD Countries