Green
Visualizing the Scale of Plastic Bottle Waste Against Major Landmarks
View the original interactive visualization at Reuters Graphics.
Visualizing the Scale of Plastic Bottle Waste
By the time you’re finished reading this sentence, tens of thousands of plastic bottles will have been sold around the world.
The ubiquitous plastic bottle has proven to be a versatile and cost-effective vessel for everything from water to household cleaning products. Despite this undeniable utility, it’s becoming harder to ignore the sheer volume of waste created by the world’s 7.5 billion people.
Today’s data visualization from Simon Scarr and Marco Hernandez at Reuters Graphics puts into perspective the immense scale of plastic bottle waste by comparing it to recognizable global landmarks, and even the entirety of Manhattan.
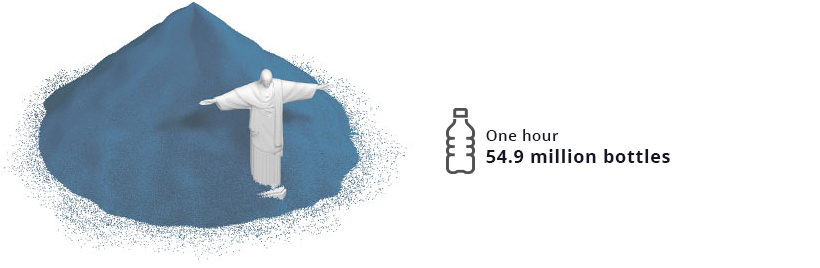
Plastic Wasted in One Hour
Original image from REUTERS/Simon Scarr, Marco Hernandez.
Every hour, close to 55 million bottles are discarded worldwide. When accumulated, the pile would be higher than the Brazilian Art Deco statue, Christ the Redeemer.
Towering over Rio de Janeiro at 125 feet (38 meters) and with arms outstretched to 98ft (30m), the statue still pales in comparison next to the combined plastic bottle waste over this time period.
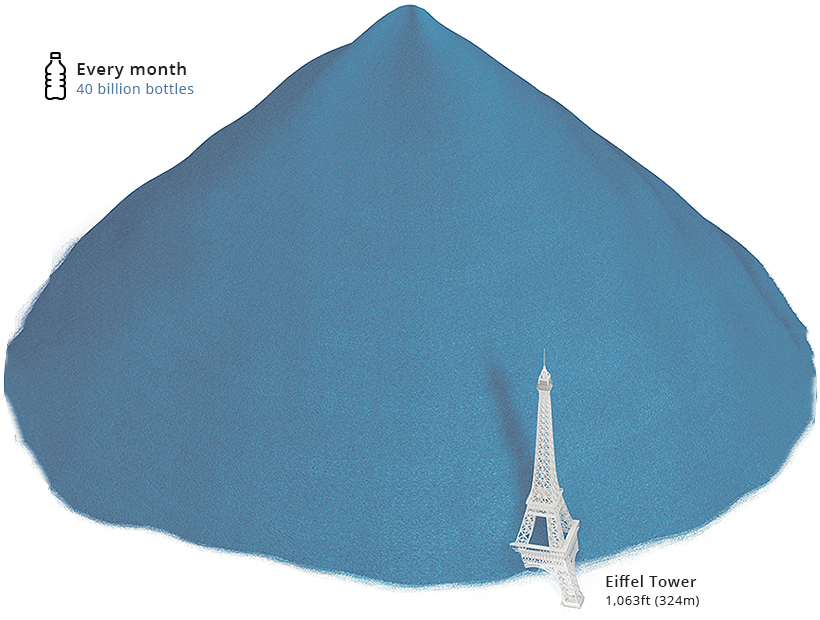
Plastic Bottle Waste: Daily and Monthly

Original image from REUTERS/Simon Scarr, Marco Hernandez.
In the span of a day, over 1.3 billion bottles are discarded. If you were to take the elevator up the Eiffel Tower (which has a total height of 1,063ft or 324m), you’d reach the tip of this pile about halfway up.
Fast forward this by a month, however, and it’s a different story. The Eiffel Tower seems like a figurine next to a heap of approximately 40 billion tossed plastic bottles.
Original image from REUTERS/Simon Scarr, Marco Hernandez.
Scaling this up, data from Euromonitor International reveals that over 481 billion plastic bottles are now wasted annually.
Accumulated, this would dwarf even Dubai’s famous Burj Khalifa, the world’s tallest structure at an impressive 2,722ft (830m).
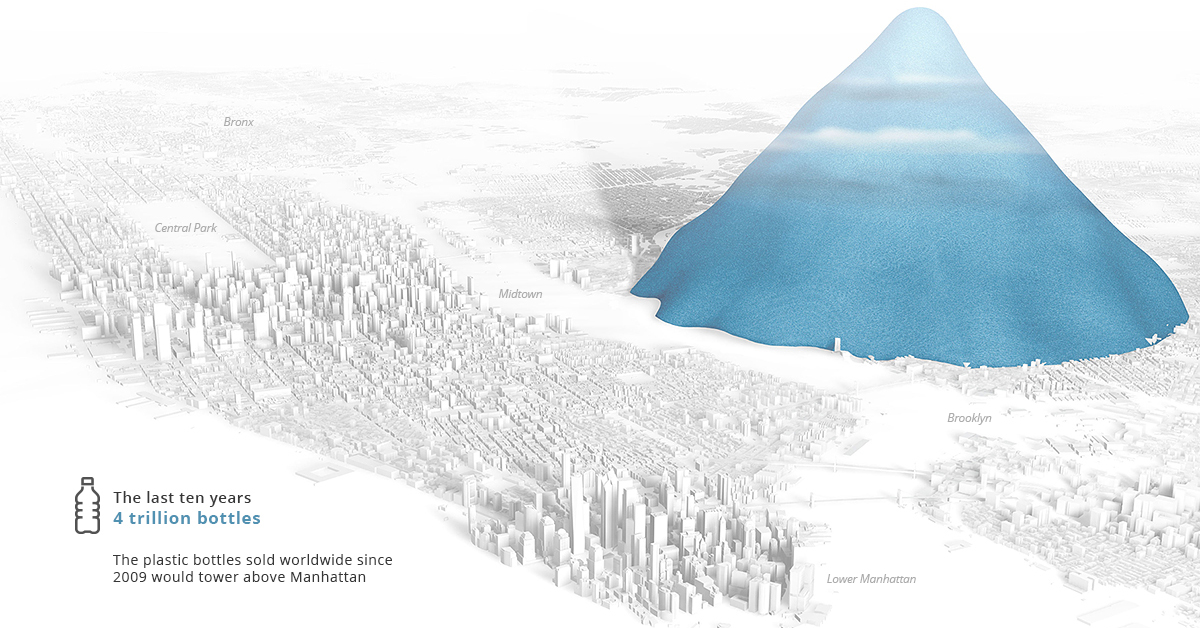
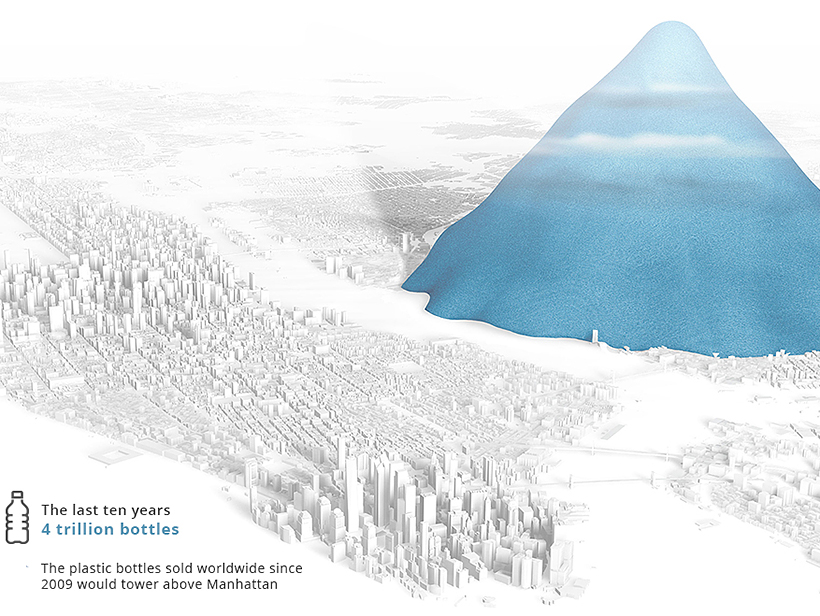
A Decade of Plastic
According to Reuters, nearly 4 trillion bottles were sold in the past ten years, each contributing to a 7,874ft high pile of plastic (2.4km).
Original image from REUTERS/Simon Scarr, Marco Hernandez.
If all plastic bottle waste were piled up in this manner, New Yorkers would see a translucent mountain every time they looked out their window rising to over half the elevation of the tallest peak in the Rocky Mountains, which is 14,440ft (4.4km) high.
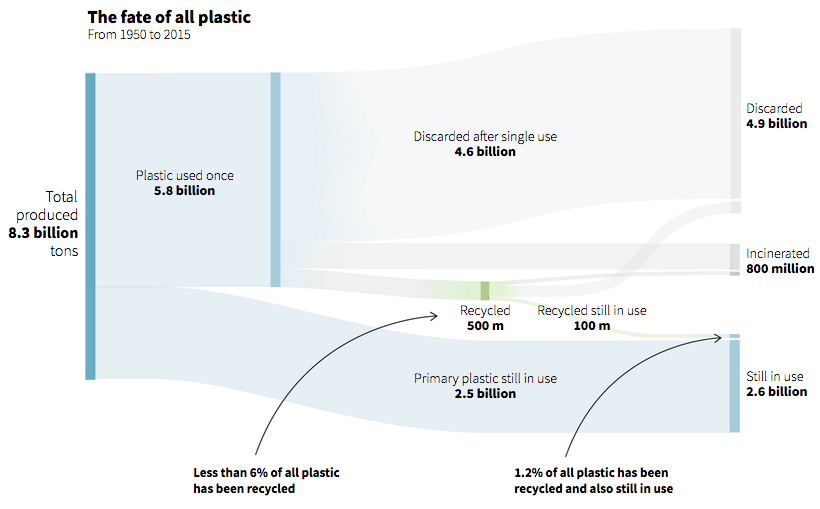
The Global Flow of Plastic Waste Since 1950
Plastic bottles are just the tip of the iceberg for single-use plastics. Other examples include plastic bags, food packaging, coffee cup lids, and straws. As plastic use continues to flourish, even our best attempts at managing waste are falling short.
In fact, only an abysmal 6% of all plastic produced since 1950 has been recycled, with the majority ending up in landfills as litter, or getting incinerated.
Original image from REUTERS/Simon Scarr, Marco Hernandez.
Our plastic use is on an unsustainable trajectory, but countries are taking specific actions to curb use. Canada and the European Union (EU) will ban certain single-use plastics by 2021—and they are among 60 other nations enacting similar policies.
Corporations are also taking steps to reduce impact. A good example of this is Unilever, which made a commitment to make all its packaging reusable, recyclable, or compostable by 2025.


Green
Ranking the Top 15 Countries by Carbon Tax Revenue
This graphic highlights France and Canada as the global leaders when it comes to generating carbon tax revenue.


Top 15 Countries by Carbon Tax Revenue
This was originally posted on our Voronoi app. Download the app for free on iOS or Android and discover incredible data-driven charts from a variety of trusted sources.
Carbon taxes are designed to discourage CO2 emissions by increasing the cost of carbon-intensive activities and incentivizing the adoption of cleaner energy alternatives.
In this graphic we list the top 15 countries by carbon tax revenue as of 2022. The data is from the World Bank’s State and Trends of Carbon Pricing Report, published in April 2023.
France and Canada Lead in Global Carbon Tax Revenue
In 2022, the top 15 countries generated approximately $30 billion in revenue from carbon taxes.
France and Canada lead in this regard, accounting for over half of the total amount. Both countries have implemented comprehensive carbon pricing systems that cover a wide range of sectors, including transportation and industry, and they have set relatively high carbon tax rates.
| Country | Government revenue in 2022 ($ billions) |
|---|---|
| 🇫🇷 France | $8.9 |
| 🇨🇦 Canada | $7.8 |
| 🇸🇪 Sweden | $2.3 |
| 🇳🇴 Norway | $2.1 |
| 🇯🇵 Japan | $1.8 |
| 🇫🇮 Finland | $1.7 |
| 🇨🇭 Switzerland | $1.6 |
| 🇬🇧 United Kingdom | $0.9 |
| 🇮🇪 Ireland | $0.7 |
| 🇩🇰 Denmark | $0.5 |
| 🇵🇹 Portugal | $0.5 |
| 🇦🇷 Argentina | $0.3 |
| 🇲🇽 Mexico | $0.2 |
| 🇸🇬 Singapore | $0.1 |
| 🇿🇦 South Africa | $0.1 |
In Canada, the total carbon tax revenue includes both national and provincial taxes.
While carbon pricing has been recognized internationally as one of the more efficient mechanisms for reducing CO2 emissions, research is divided over what the global average carbon price should be to achieve the goals of the Paris Climate Agreement, which aims to limit global warming to 1.5–2°C by 2100 relative to pre-industrial levels.
A recent study has shown that carbon pricing must be supported by other policy measures and innovations. According to a report from Queen’s University, there is no feasible carbon pricing scenario that is high enough to limit emissions sufficiently to achieve anything below 2.4°C warming on its own.

-

 Green2 weeks ago
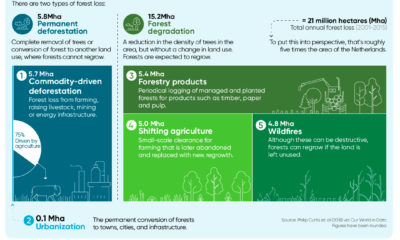
Ranked: Top Countries by Total Forest Loss Since 2001
-

 Travel1 week ago
Ranked: The World’s Top Flight Routes, by Revenue
-

 Technology2 weeks ago
Ranked: Semiconductor Companies by Industry Revenue Share
-

 Money2 weeks ago
Which States Have the Highest Minimum Wage in America?
-

 Real Estate2 weeks ago
Ranked: The Most Valuable Housing Markets in America
-

 Markets2 weeks ago
Charted: Big Four Market Share by S&P 500 Audits
-

 AI2 weeks ago
The Stock Performance of U.S. Chipmakers So Far in 2024
-

 Automotive2 weeks ago
Almost Every EV Stock is Down After Q1 2024